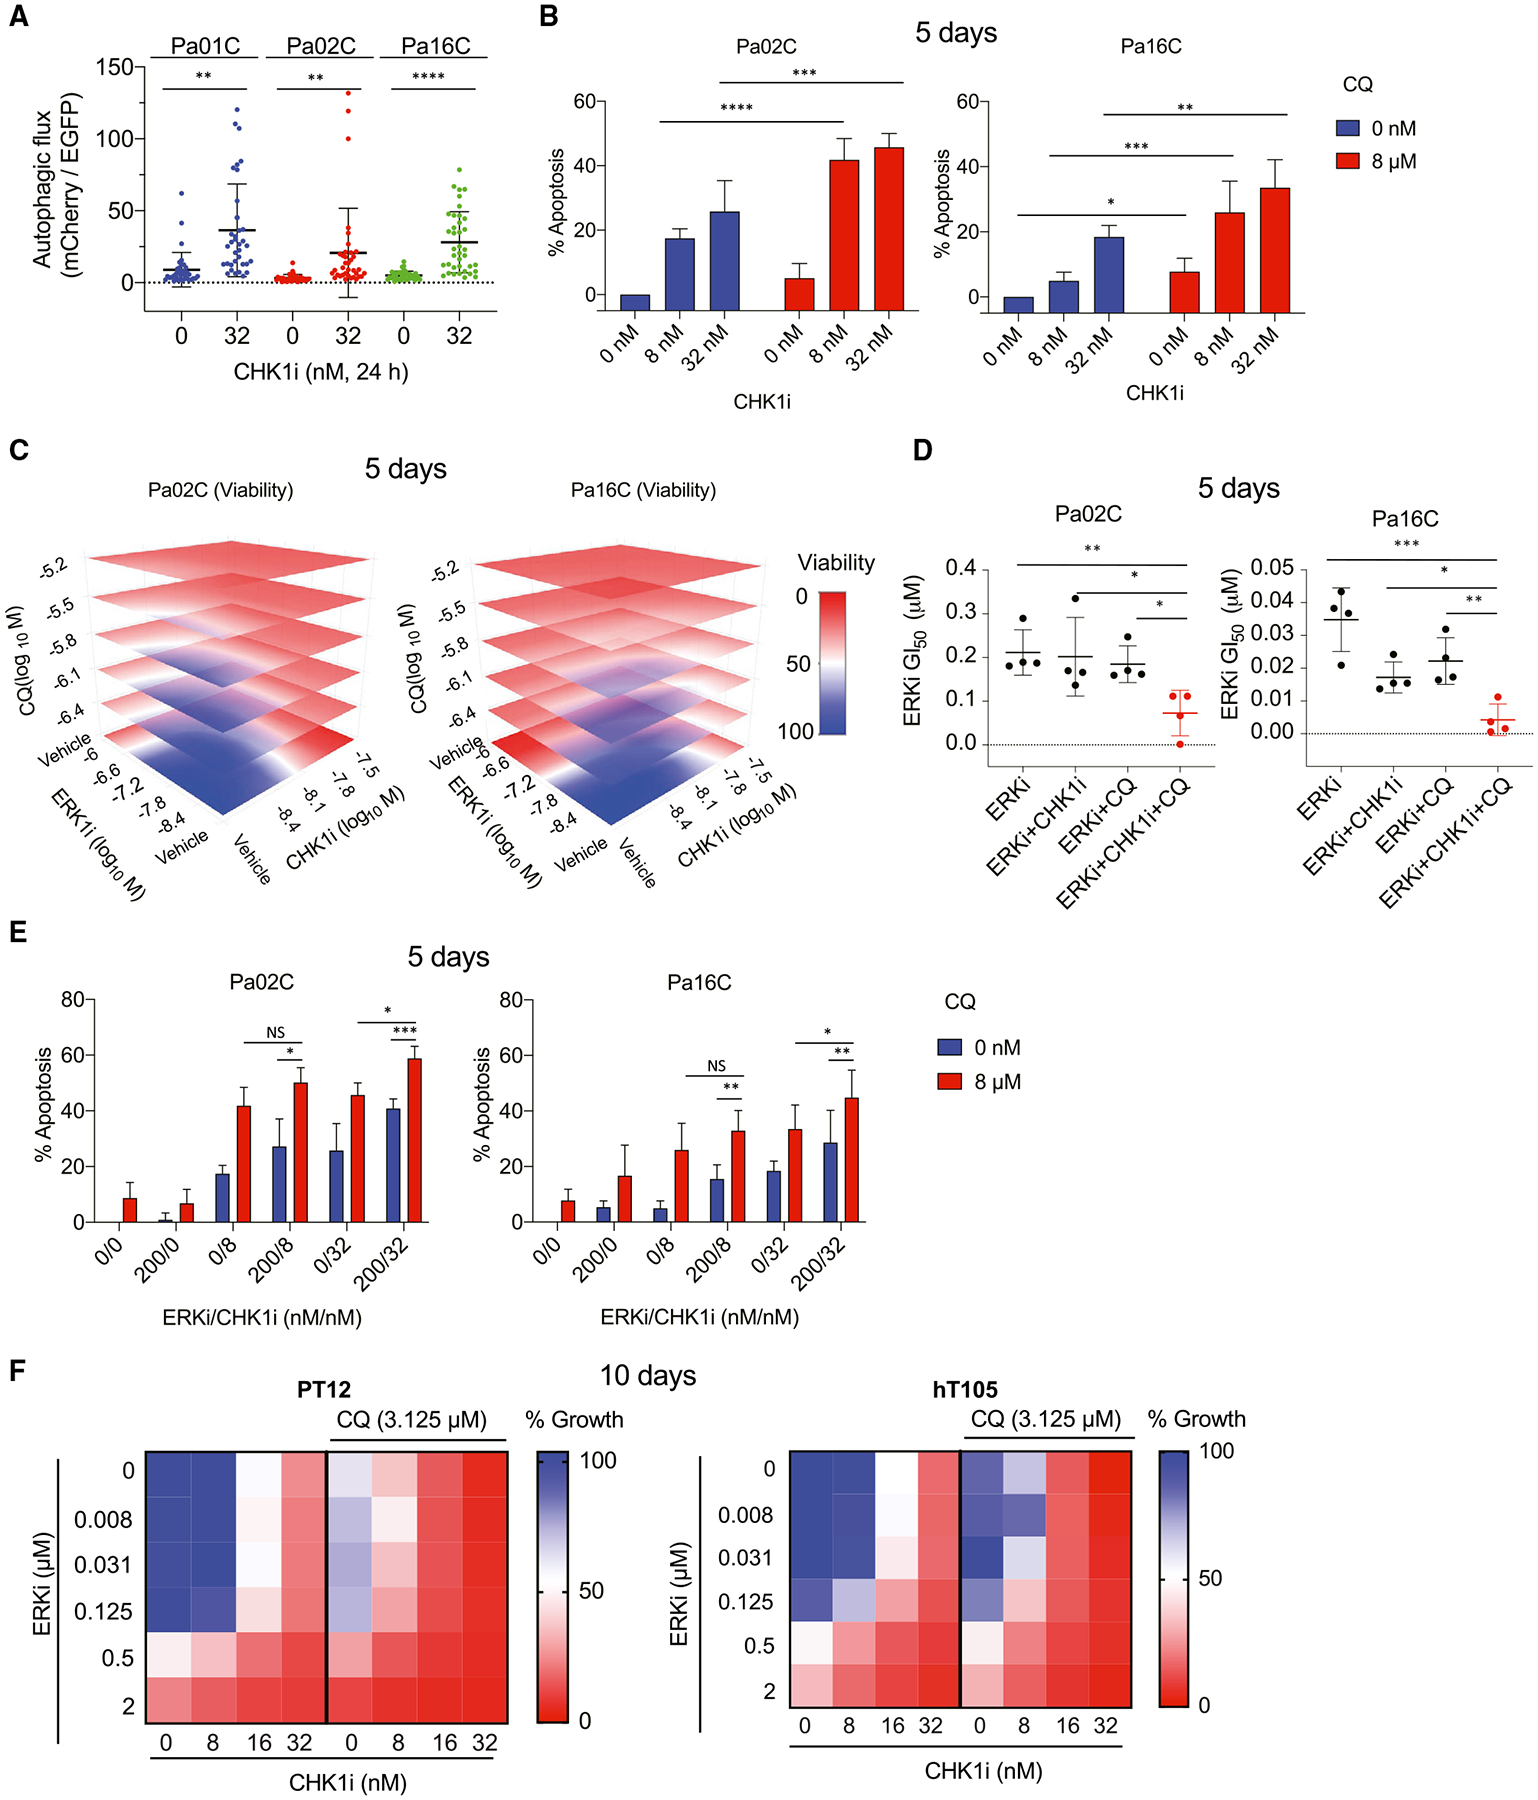
Figure 7. CHK1 inhibition induces autophagy.

(A) Cell lines stably expressing the autophagic flux biosensor mCherry-EGFP-LC3B were imaged following treatment with CHK1i (32 nM, 24 h) or vehicle control. Significance was evaluated using an unpaired t test; **p < 0.01, ****p <0.0001. Representative images are shown in Figure S10A.
(B) Percentage of cells in apoptosis induced by CHK1i and/or chloroquine (CQ) alone or in combination (5 days) was determined via FITC-Annexin V staining and flow cytometry. Significance was determined using two-way ANOVA and Tukey’s multiple-comparisons test; *p < 0.05, **p < 0.01, ***p < 0.001.
(C) Cells were treated for 5 days with the indicated concentrations of ERKi, CHK1i, and/or CQ alone or in combination. Cell growth was evaluated using live cell counting. For the kill effect, a shift from blue to red indicates a decrease in viability.
(D) Graph showing alterations in the GI50 of ERKi following treatment combinations as shown in (C). GI50 shifts are shown for Pa02C and Pa16C cells treated with CHK1i at 4 and 8 nM, respectively, and 1.56 μM of CQ. Significance was determined as in (B).
(E) Cells were treated simultaneously with CHK1i (8 or 32 nM) and ERKi (200 nM), with or without CQ (8 μM) for 5 days. Cells were collected, and apoptosis was determined using FACS analysis of Annexin V- and propidium iodide-labeled cells. Significance was determined as in (B).
(F) The same triple combinations as in (C)–(E) were evaluated in patient-derived PDAC organoids. Organoids were treated for 10 days with the indicated concentrations of ERKi and CHK1i, with or without CQ (3.125 μM). The median of three biological replicates for each treatment is shown, and a shift from blue to red indicates reduction in organoid viability as assessed using CellTiter Glo.
In (A)–(E) all experiments were performed in biological triplicate (A–D) or quadruplicate (E), and graphs represent the mean and SD.
