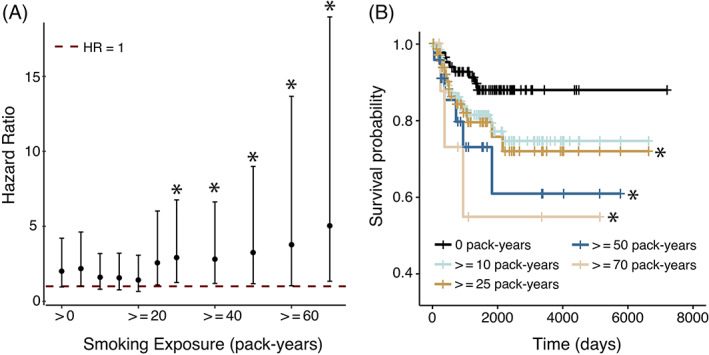
FIGURE 1.

RFS among p16+ OPSCC patients by smoking exposure level. (A) Hazard ratio of patients with smoking exposure above the threshold given by x‐axis (ie, exposure is greater than or equal to (>=) than this threshold, or strictly greater than (>) zero) as compared to non‐smoking patients (ie, exposure equals 0). Error bars represent the 95% confidence interval. All subgroups of patients with 25 pack‐years or greater were found to have significantly decreased RFS. (B) Kaplan‐Meier plots showing survival as stratified by smoking exposure groups. The symbol “*” indicates a significant decrease in RFS (log‐rank test, P < .05)
