
FIGURE 3.
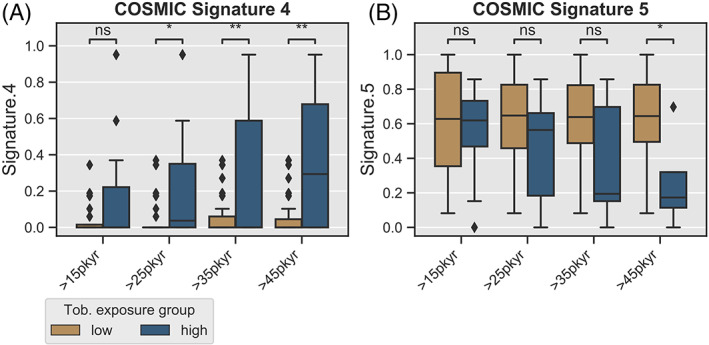
COSMIC Signatures of p16+ OPSCC tumors by smoking exposure level. (A) Proportion of COSMIC signature 4 (associated with tobacco exposure) related mutations (y‐axis) as identified by R package deconstructSigs package, as a function of smoking exposure. X‐axis represents sliding cut‐off separating samples into “high” and “low” categories. (B) COSMIC signature 5 (mutagenic mechanism unknown) vs smoking exposure. Boxplots—box represents IQR and whiskers include data within 1.5 (IQR)