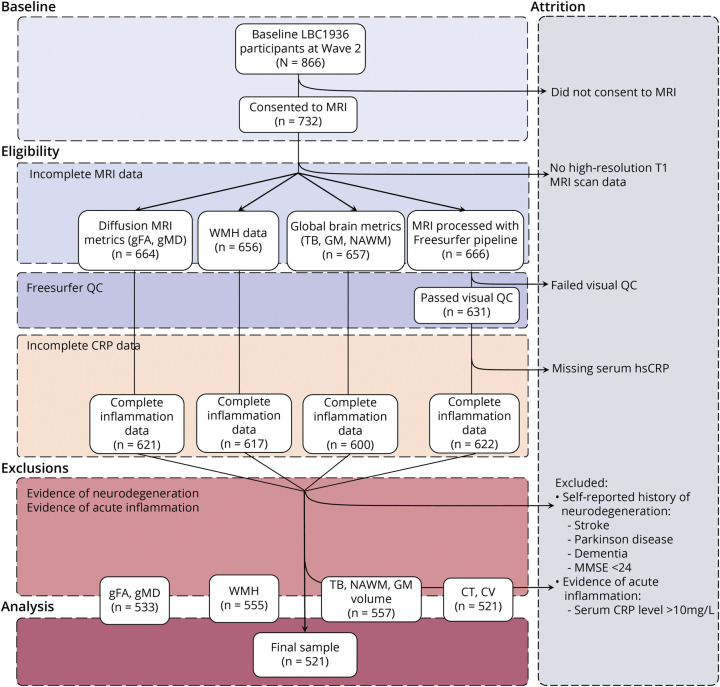
Figure 2. Flowchart Depicting the Step-by-Step Selection Process of the Lothian Birth Cohort 1936 (LBC1936) Participants Included in the Final Sample for Data Analyses.
CRP = C-reactive protein; CT = cortical thickness; CV = cortical volume; gFA = general fractional anisotropy; GM = gray matter; gMD = general mean diffusivity; hsCRP = high-sensitivity C-reactive protein; MMSE = Mini-Mental State Examination; NAWM = normal appearing white matter; QC = quality control; TB = total brain volume; WMH = white matter hyperintensities.

