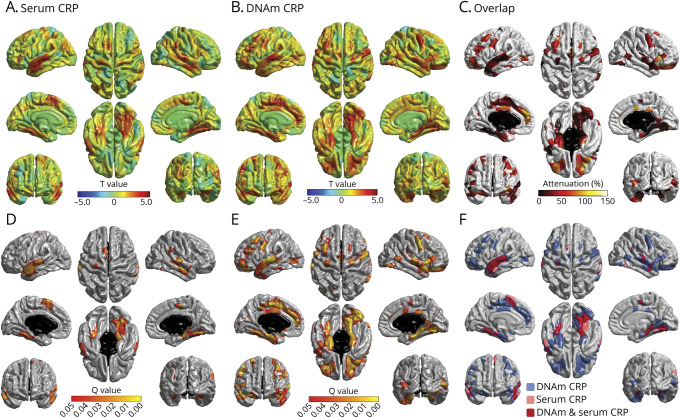
Figure 3. DNAm CRP Shows Stronger and More Widespread Associations With Global and Regional Brain Structure Than Serum CRP.
Regional cortical volume regressed against serum C-reactive protein (CRP) (A, D) and DNA methylation (DNAm) CRP (B, E) (n = 521). Colors denote the magnitude (T-maps; top) and significance (Q values; bottom) of the negative associations between inflammation and brain cortical volume. (C) Percentage attenuation for the significant associations between DNAm-CRP and cortical volume when also controlling for serum CRP. Conjunction plot (F) shows the spatial extent of independent contributions and overlap (red) in cortical loci that exhibit false discovery rate (FDR)–corrected unique associations with simultaneously modeled serum (pink) and epigenetic (blue) inflammation measures; results are corrected for sex, age, and intracranial volume.

