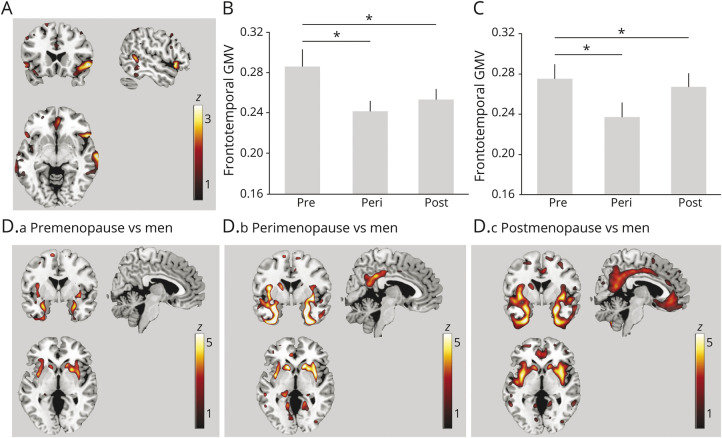
Figure 1. Associations Between Menopause Status and GMV.
(A) Statistical parametric maps (SPMs) showing negative associations between menopause status and regional gray matter (GM) volume (GMV), adjusted for age and total intracranial volume (TIV). Anatomic location and statistics are reported in eTable 2, links.lww.com/WNL/B612. (B) Plots representing age- and TIV-adjusted mean (±SEM) GMV extracted at the peak of statistical significance, expressed in units of GM density, comparing premenopausal (PRE), perimenopausal (PERI), and postmenopausal (POST) groups in the entire cohort. (C) Plots representing GMV by menopause status among nonhysterectomized participants. (D.a-D.c) SPMs showing GMV differences between each menopausal group and men, adjusted by age and TIV. Anatomic location and statistics are reported in eTable 2. SPMs are superimposed on a standardized MRI and represented on a color-coded scale with corresponding z score values. *Significant at p < 0.05.

