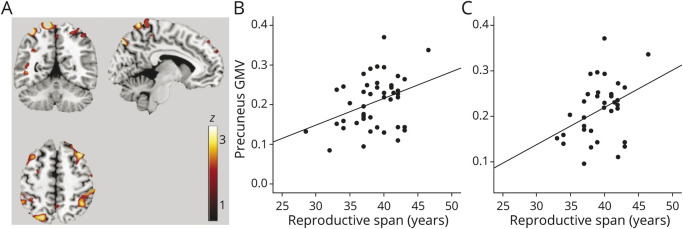
Figure 2. Associations Between Reproductive Span and GMV.
(A) Statistical parametric maps (SPMs) showing positive associations between reproductive span years and regional gray matter volume (GMV) at p < 0.05, cluster level corrected, adjusted for age and total intracranial volume. SPMs are superimposed on a standardized MRI and represented on a color-coded scale with corresponding z score values. (B) Plots depicting correlations between reproductive years and GMV extracted at the peak of statistical significance in the entire cohort and (C) among nonhysterectomized participants.

