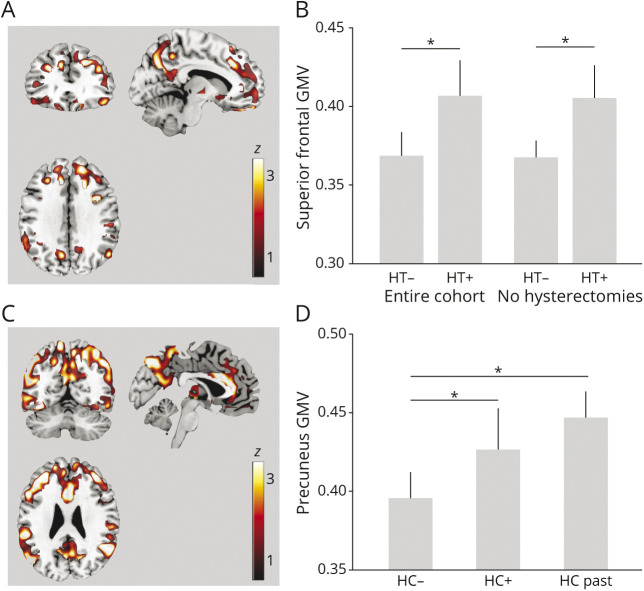
Figure 4. Associations Between Exogenous Estrogen Exposures and GMV.
Statistical parametric maps (SPMs) showing positive associations between (A) menopause hormonal therapy (HT) and gray matter volume (GMV) and (C) hormonal contraceptive (HC) use and GMV, at p < 0.05, cluster level corrected, adjusted for age and total intracranial volume (TIV). SPMs are superimposed on a standardized MRI and represented on a color-coded scale with corresponding z score values. Anatomic location and statistics are reported in eTable 4, links.lww.com/WNL/B612. Plots representing age- and TIV-adjusted mean (+SEM) GMV extracted at the peak of statistical significance, comparing (B) HT users (HT+) and never users (HT−) in the entire cohort and among nonhysterectomized participants and (D) HC current users (HC+), past users (HC-past), and never users (HC−). *p < 0.05.

