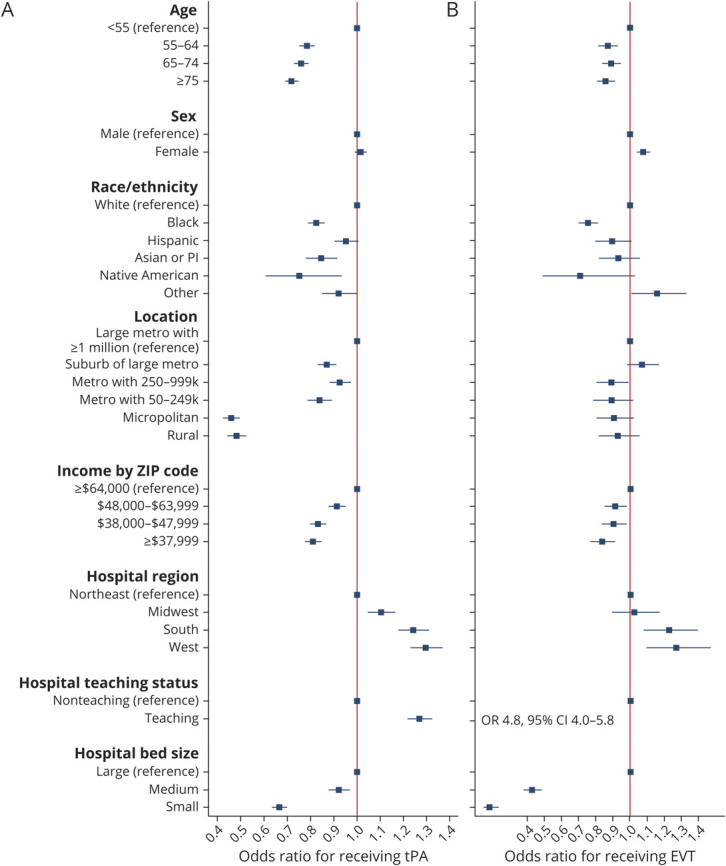
Figure 2. Adjusted Odds of Receiving IV Alteplase (tPA) Shown for Demographic, Hospital, and Socioeconomic Categories in the Full Cohort and for Those Receiving EVT.

Adjusted odds of receiving IV alteplase (tissue plasminogen activator [tPA]) shown for demographic, hospital, and socioeconomic categories in the full cohort (A) and for those receiving endovascular therapy (EVT) (B). Model adjusted for patient age, sex, race/ethnicity, hospital Census region, hospital teaching status, hospital bed size, patient location, and median household income by patient zip code. Model in patients with an National Institutes of Health Stroke Scale (NIHSS) is also adjusted for NIHSS. CI = confidence interval; OR = odds ratio.
