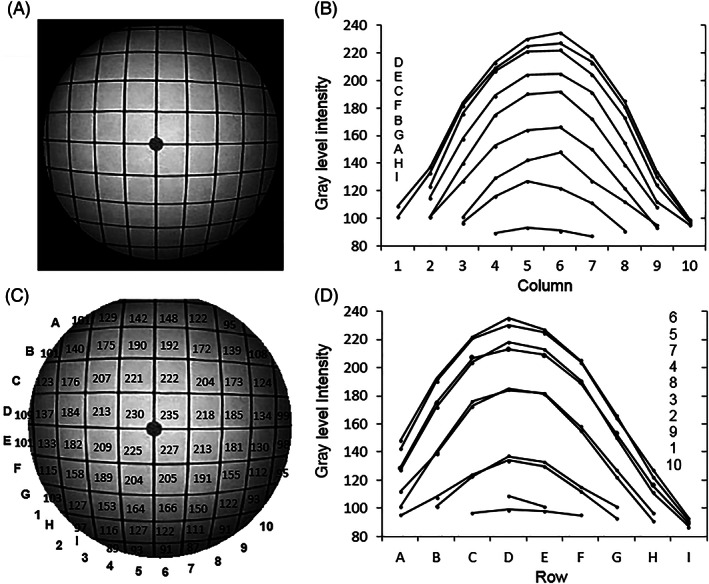
FIGURE 2.

Light intensity distribution for the 0° endoscope. (A) The image; (B) image intensity plots for each row; (C) image intensities at each grid; (D) image intensity plots for each column (the letter and number legends in (B) and (D) correspond to the layout of the individual plots)
