Fig. 3.
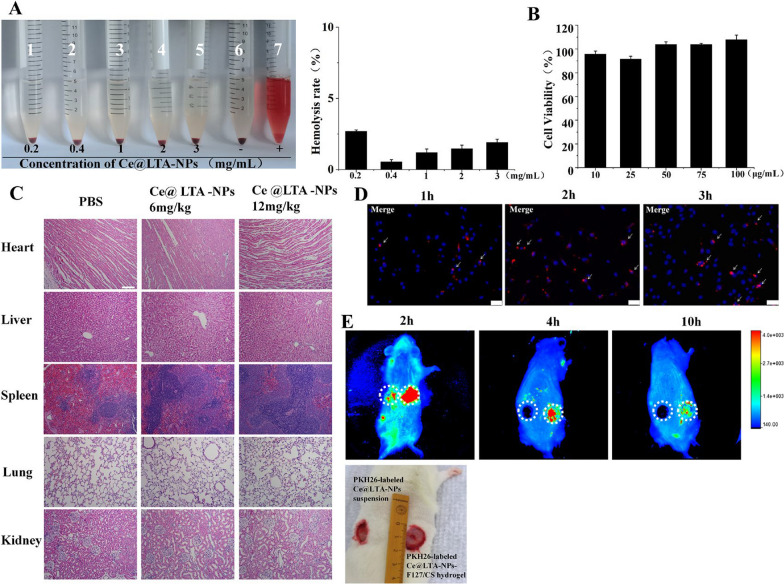
Biocompatibility evaluation of Ce@LTA-NPs A Haemolysis determined by observing whether the red blood cells were ruptured after treatment with different concentrations of Ce@LTA-NPs. B The viability of HUVEC cells at 24 h after treatment with different concentrations of Ce@LTA-NPs. C H&E staining of heart, liver, lung, spleen and kidney tissue sections after i.v. administering a single dose of 1 mL of saline and 1 mL of various amount of Ce@LTA-NPs (6 mg/kg and 12 mg/kg per day) for 15 days. The scale bar is 100 μm. D Representative fluorescence images of PKH26-labelled Ce@LTA-NPs incubated with HG-HUVECs for 1 h, 2 h and 3 h. The scale bar is 50 μm. E Representative fluorescence images (overlaid with photograph) of diabetic wound site which receiving the treatment of PKH26-labelled Ce@LTA-NPs suspension and PKH26-labelled Ce@LTA-NPs-F127/CS hydrogel at 2 h, 4 h, and 10 h. The round circle indicated the diabetic wound site. All Data were expressed as mean ± SD (n = 3)

