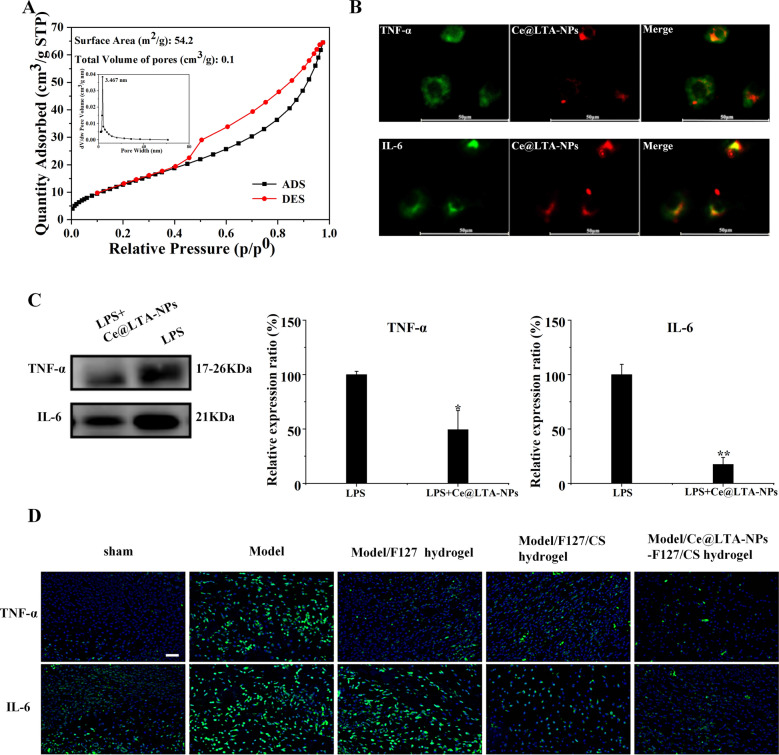
Fig. 5.
Ce@LTA-NPs neutralized inflammatory factors in vivo and in vitro. A BET analysis for Ce@LTA-NPs. B Co-localization analysis of inflammatory factors and Ce@LTA-NPs in macrophages exposed to LPS. The scale bar is 50 μm. C Western blot analysis of the expression levels of TNF-α and IL-6 in culture medium from LPS stimulated macrophages treated with 50 μg/mL Ce@LTA-NPs. The data are expressed as the mean ± SD (n = 3), *p < 0.05, **p < 0.01, Relative expression ratio (%) of TNF-α and IL-6 was determined by calculating the expression level of TNF-α and IL-6 in group to the expression level of TNF-α and IL-6 in LPS treated group. D Immunofluorescence assay of the expression of TNF-α and IL-6 in diabetic wound treated with F127 hydrogel, F127/CS hydrogel and Ce@LTA-NPs-F127/CS hydrogel. The scale bar is 50 μm

