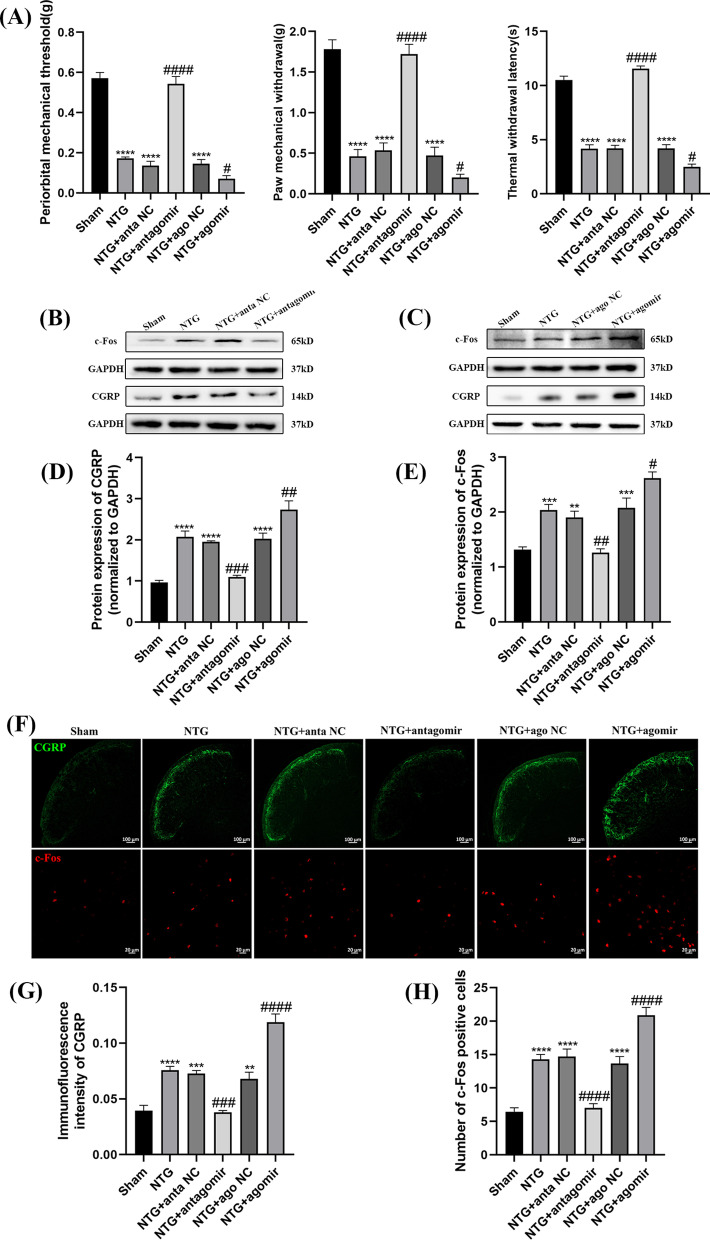
Fig. 4.
The effects of miR-155-5p antagomir and agomir on hyperalgesia and the expression of CGRP, c-Fos. A The mechanical and thermal pain thresholds in different groups. Compared with the Sham group, pain thresholds significantly decreased in the NTG group. Compared with the NTG + anta NC group, the pain thresholds were notably increased in the NTG + miR-155-5p antagomir group. The pain thresholds in the NTG + miR-155-5p agomir group were reduced compared to NTG + ago NC group. B, C, D, E The protein expression of CGRP and c-Fos. Compared with the Sham group, the protein levels of CGRP and c-Fos notably increased in NTG group. Compared with the NTG + anta NC group, the expression of CGRP and c-Fos were decreased in the NTG + miR-155-5p antagomir group. The expression of CGRP and c-Fos in the NTG + miR-155-5p agomir group was significantly increased compared to NTG + ago NC group. F, G, H Immunofluorescence staining images of CGRP and c-fos. Compared with the Sham group, the immunofluorescence intensity of CGRP and number of c-Fos-positive cells evidently increased in NTG group. Compared with the NTG + anta NC group, the immunofluorescence intensity of CGRP and number of c-Fos-positive cells were markedly decreased in the NTG + miR-155-5p antagomir group. The immunofluorescence intensity of CGRP and number of c-Fos-positive cells in the NTG + miR-155-5p agomir group were increased compared to NTG + ago NC group. There were no significant differences among the NTG, NTG + anta NC and NTG + ago NC groups. (n = 6–8 in each group; scale bar = 20/100 μm; **p < 0.01, ***p < 0.001 and ****p < 0.0001 compared with the Sham group; #p < 0.05, ##p < 0.01, ###p < 0.001 and ####p < 0.0001 compared with the NTG + NC groups)

