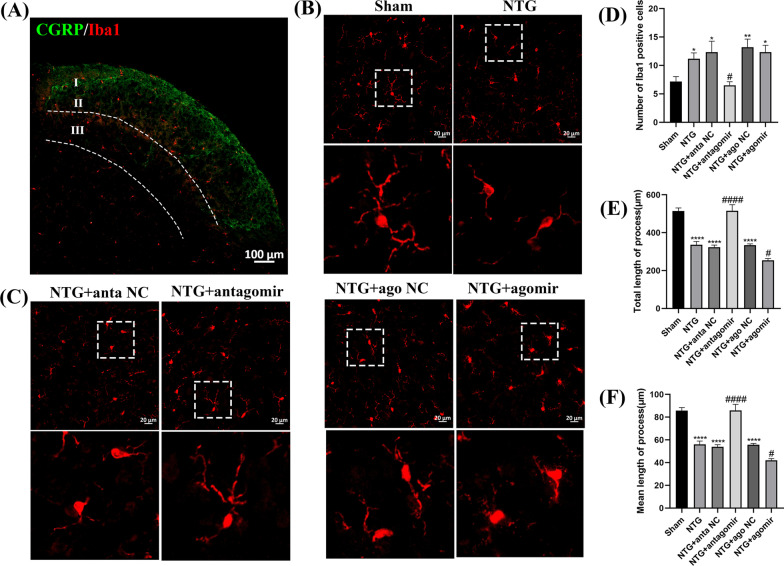
Fig. 7.
The effects of miR-155-5p antagomir and agomir on proliferation and morphological changes of microglia. A Immunofluorescence analysis of Iba1 was restricted to laminae I, II and III of the TNC region. The NTG group was selected to present the partition more clearly. B, C, D, E, F Compared with the Sham group, the number of Iba1-immunoreactive cells increased, while the total and mean length decreased in NTG group. Compared with the NTG + anta NC group, the Iba1-immunoreactive cells distinctly decreased, while the total and mean length were higher in NTG + miR-155-5p antagomir group. The total and mean length decreased in the NTG + miR-155-5p agomir group compared to NTG + ago NC group, and no significant difference was observed in Iba1-immunoreactive cells between the two groups. There were no significant differences among the NTG, NTG + anta NC and NTG + ago NC groups. (n = 6–8 in each group; *p < 0.05, **p < 0.01 and ****p < 0.0001 compared with the Sham group; #p < 0.05 and ####p < 0.0001 compared with the NTG + NC groups)

