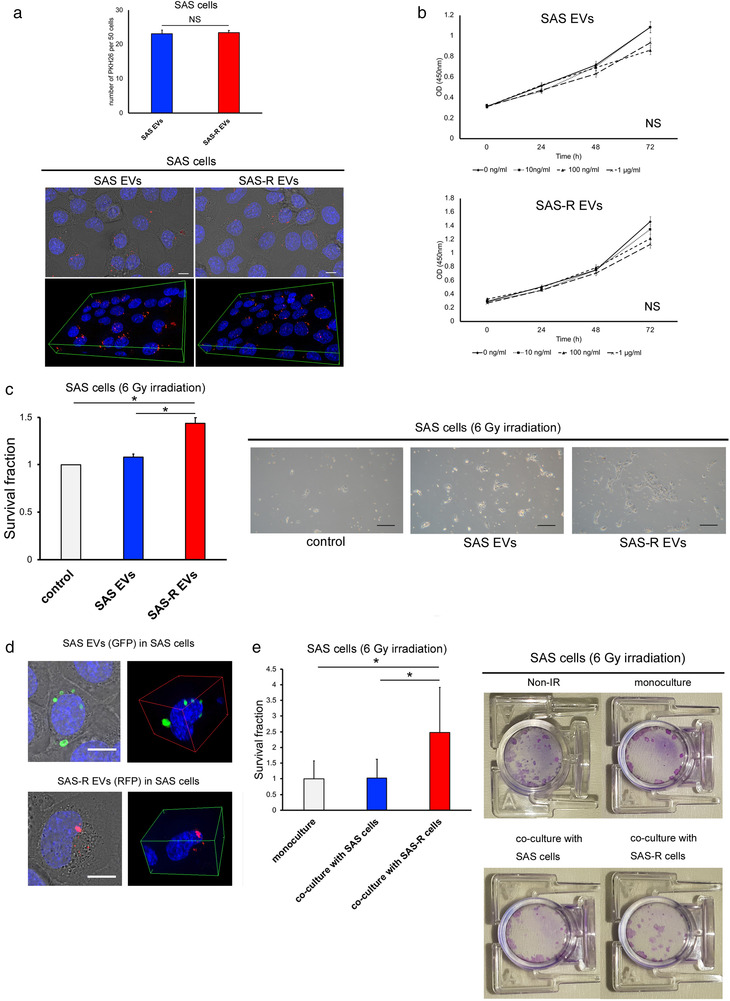
FIGURE 2.

The effect of EVs on OSCC cells. (a) Representative fluorescent microscopic images for PKH26‐labeled EVs uptake after 24 h incubation. EVs are stained red, and nuclei are stained blue with Hoechst 33342. SAS cells containing PKH26‐labeled EVs per 50 cells were quantified. Scale bar, 50 μm. (b) Proliferation of SAS cells cultivated for 3 days with various concentrations of SAS EVs or SAS‐R EVs (0, 10, 100 ng/ml or 1 μg/ml). (c) The survival fraction of SAS cells after exposure to 6 Gy X‐rays was evaluated by high‐density survival assay under SAS EVs or SAS‐R EVs (20 μg/ml). As a control an equal amount of phosphate‐buffered saline without EVs was added to SAS cells. Scale bar, 200 μm. (d) Fluorescent microscopic images of SAS cells incubated for 3 days after docking the two incubators: SAS EVs (green), SAS‐R EVs (red), and nuclei (blue with Hoechst 33342). Fluorescent labelled EVs pass through the central filter and are taken up by SAS cells in the other incubator. (e) Photographs of the cell survival fraction as evaluated by clonogenic assay. After exposure to 6 Gy, SAS cells were co‐cultured with SAS cells or SAS‐R cells in an indirect co‐culture plate. After 10 days, cells were fixed and visualized. Values are expressed as mean ± standard deviation of triplicate samples. *p < 0.05; EV, extracellular vesicles; NS, no significant differences
