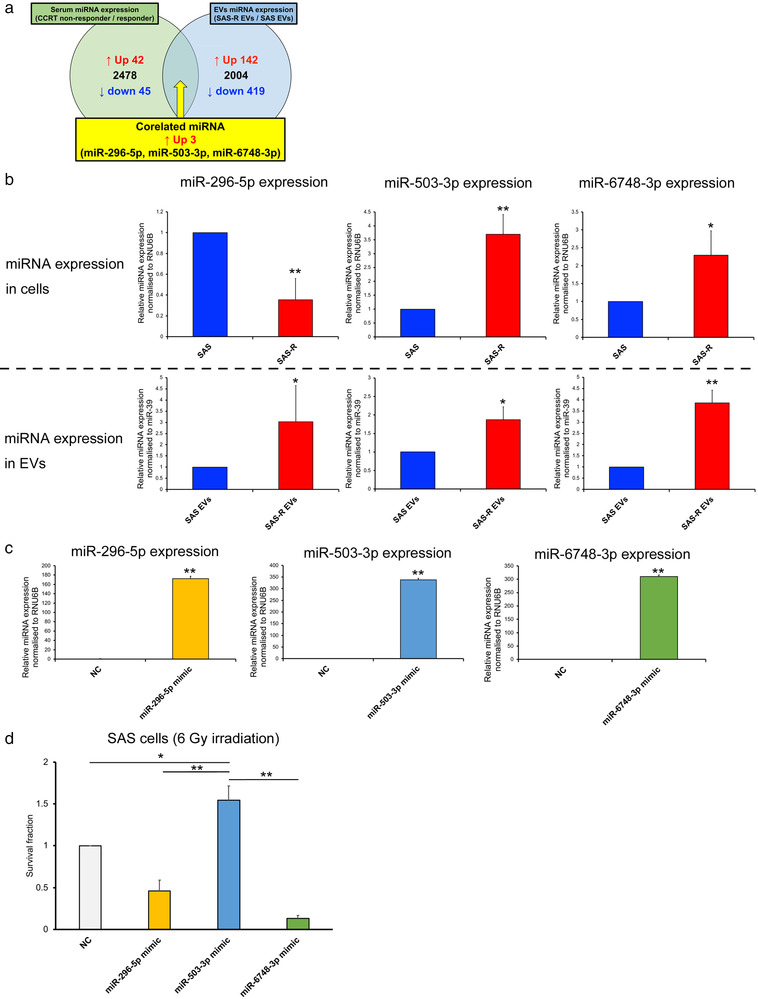
FIGURE 3.

Identification of miRNA involved in radioresistance of OSCC. (a) Venn diagram showing miRNAs that were commonly upregulated in CRT nonresponder serum samples (green) and SAS‐R EVs (blue). (b) Upper row: Comparison of miR‐296‐5p, miR‐503‐3p, and miR‐6748‐3p expression between SAS cells and SAS‐R cells. Lower row: Comparison of miR‐296‐5p, miR‐503‐3p, and miR‐6748‐3p expression between SAS EVs and SAS‐R EVs. The expression of miRNAs was evaluated by RT‐qPCR. (c) Expression of miR‐296‐5p, miR‐503‐3p, and miR‐6748‐3p in SAS cells 48 h after transfection with negative control or miRNA mimic. The efficiency of transfection was evaluated by RT‐qPCR. (d) SAS cells were exposed to 6 Gy of X‐ray and then transfected with negative control or miRNA mimic; the survival fraction was evaluated by high‐density survival assay. Values are expressed as mean ± standard deviation of triplicate samples. *p < 0.05; **p < 0.01. OSCC, oral squamous cell carcinoma; RT‐qPCR, real‐time quantitative polymerase chain reaction
