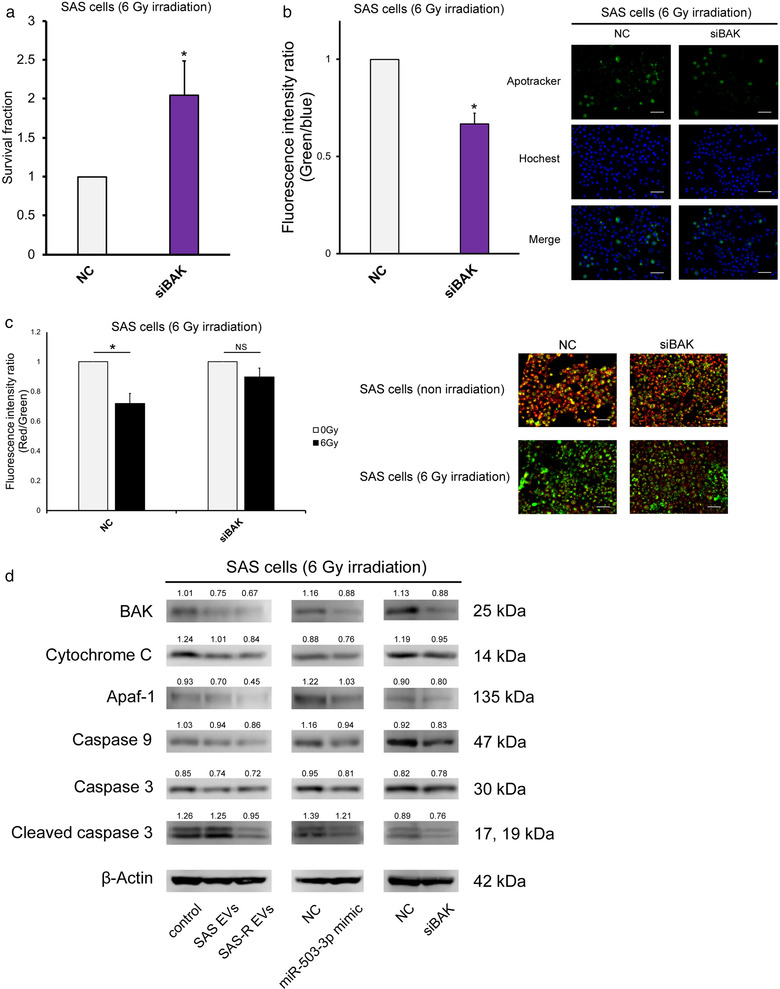
FIGURE 5.

BAK silencing mimics the biological effects of miR‐503‐3p overexpression in SAS cells. (a) SAS cells were exposed to 6 Gy and then transfected with negative control or siBAK; the survival fraction was evaluated by high‐density survival assay. (b) The graph on the left shows the fluorescence intensity ratio of green (Apotracker) and blue (Hochest 33342) 48 h after irradiation with 6 Gy. Each representative immunofluorescence image of Apotracker in SAS cells (transfected with negative control or siBAK) is shown on the right. These images are in the state 48 h after irradiation. (c) Change in mitochondrial membrane potential (MitoMP) level of irradiated (6 Gy) SAS cells after siBAK transfection. A representative immunofluorescence image is shown right the graph (48 h after irradiation). When the MitoMP is high, the cells fluoresce red, and when it is low, they fluoresce green. (d) Western blots of apoptosis molecular component (BAK, cytochrome C, Apaf‐1, caspase 9, caspase3, cleaved caspase 3) in SAS cells 48 h after 6 Gy irradiation. Mean values were obtained using an image analyser (Figure S5) from at least three independent experiments are shown at the top of each band. Values are expressed as mean ± standard deviation of triplicate samples. *p < 0.05; NS, no significant differences
