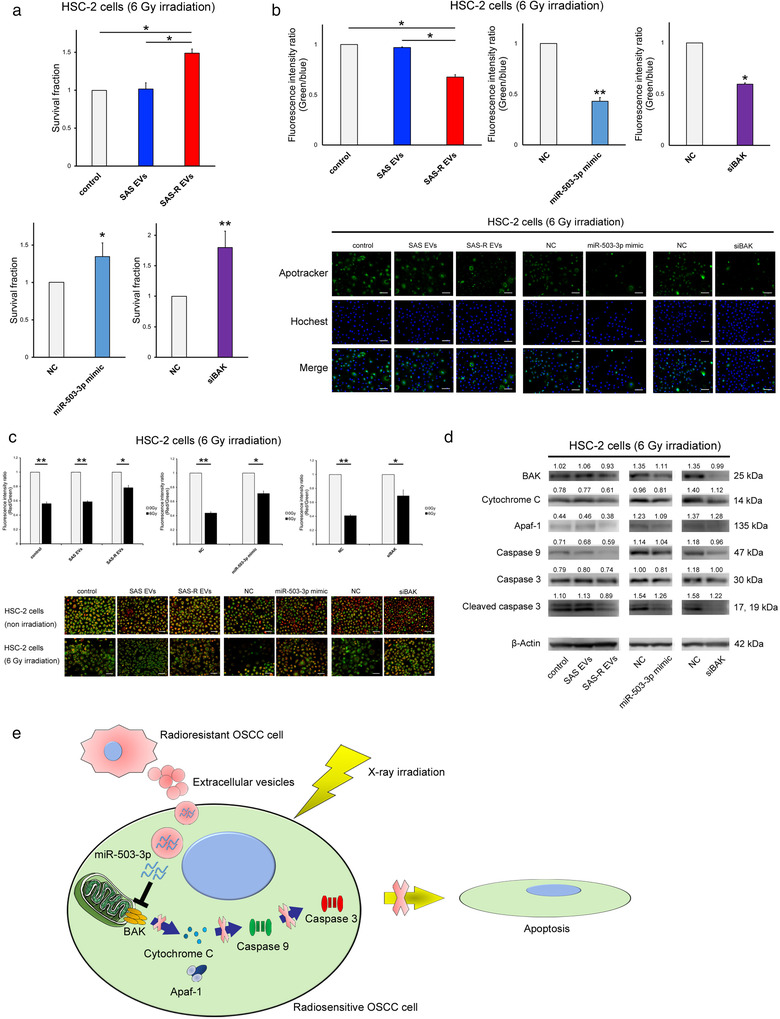
FIGURE 6.

Reproducibility experiment using HSC‐2 cells. (a) HSC‐2 cells were exposed to 6 Gy and then treated with phosphate‐buffered saline (control) or SAS‐R EVs (10 μg) / transfected with negative control (NC) or miR‐503‐3p mimic/transfected with NC or siBAK; the survival fraction was evaluated by HDS assay. (b) Graph showing the fluorescence intensity ratio of green (Apotracker) and blue (Hochest 33342) 48 h after irradiation with 6 Gy. Each representative immunofluorescence image of Apotracker in HSC‐2 cells is shown below the graph. These images are captured 48 h after irradiation. (c) Change in mitochondrial membrane potential (MitoMP) level of irradiated (6 Gy) HSC‐2 cells. A representative immunofluorescence image is shown below the graph (48 h after irradiation). When the MitoMP is high, the cells emit red fluorescence, and when it is low, the cells emit green fluorescence. (d) Western blots of apoptosis molecular component (BAK, cytochrome C, Apaf‐1, caspase 9, caspase 3, cleaved caspase 3) in HSC‐2 cells at 48 h after 6 Gy irradiation. (e) Schematic illustration of the EVs released from radioresistant OSCC cells‐mediated radioresistance model. When radiosensitive or radioresistant OSCC cells were exposed to X‐ray irradiation, EVs released from radioresistant OSCC cells were taken up by the radiosensitive OSCC cells. Subsequently, there was suppression of BAK by miR‐503‐3p contained in EVs, and finally inhibition of the apoptotic pathway controlled by downstream molecules of BAK, and radiosensitive cells acquire radioresistance. Mean values obtained using an image analyser (Figure S9) from at least three independent experiments are shown at the top of each band. Values are expressed as mean ± standard deviation of triplicate samples. *p < 0.05; **p < 0.01
