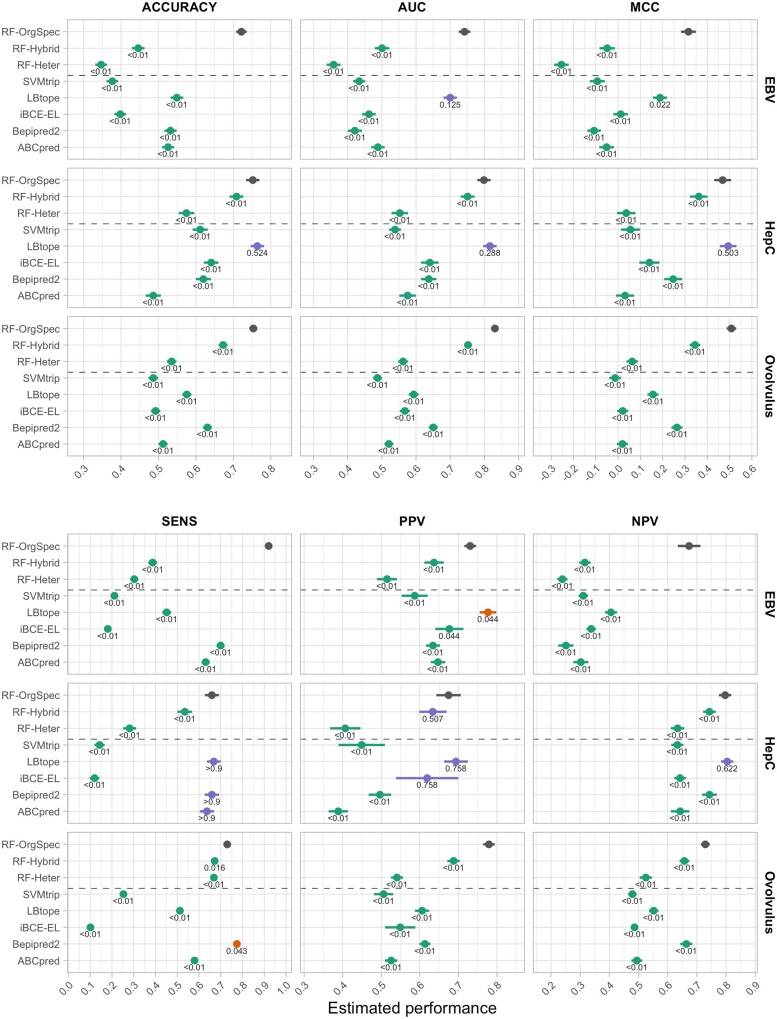
Fig. 2.
Performance estimates and standard errors of different predictors on the hold-out data of the test organisms. The values near each estimate are MHT-corrected P-values for the comparison of mean performance against RF-OrgSpec. Estimates are colour-coded for the result of significance tests at the significance level (green for significantly worse than RF-OrgSpec, red for significantly better, blue for non-statistically significant differences). The P-values were truncated at < 0.01 and > 0.9 due to loss in precision of bootstrap estimates at extreme values. Raw (uncorrected) P-values are reported in Supplementary File S1, Table S1-4

