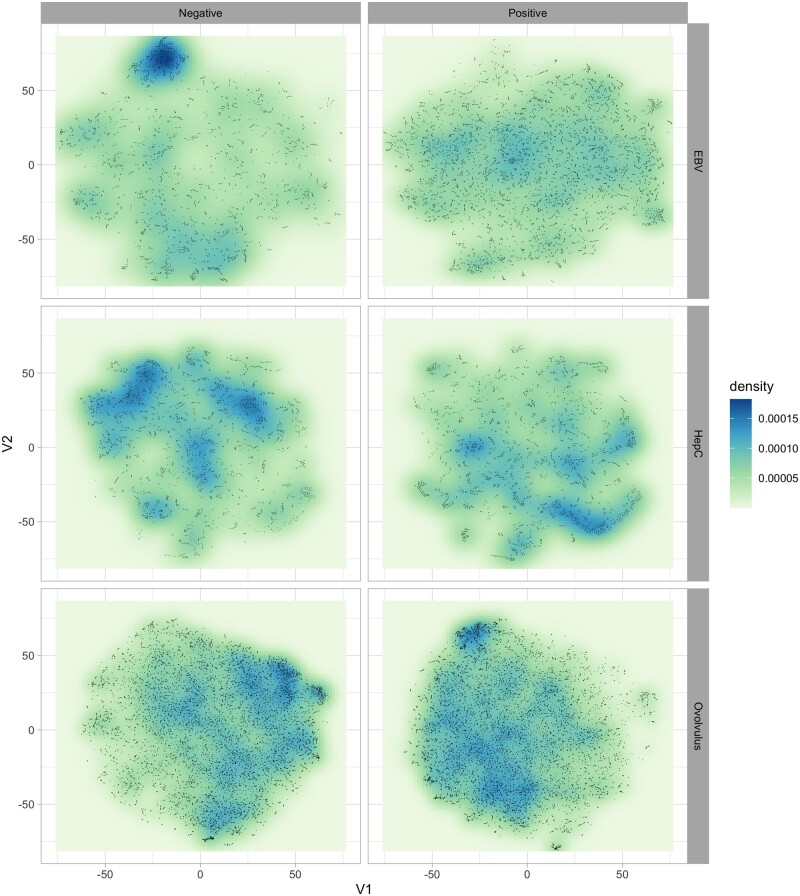
Fig. 3.
Estimated probability density of epitope and non-epitope observations in the t-SNE projection. Notice the clear distinct regions of high density of positive/negative observations, which occupy different portions of the feature space. This figure clearly illustrates how epitopes (positive observations) of different pathogens tend to occur in very distinct regions of the space of features. More importantly, regions that present a high density of positive examples for one pathogen can simultaneously have high numbers of negative observations for another—see, e.g. how the top-left portion of the negative examples of EBV and HepC coincide with a corresponding high-density regions of positive O.volvulus points. Models trained on combined (heterogeneous) data would not be able to explore these patterns, and would likely fail to detect promising regions, which may explain the increased performance of the organism-specific models when compared against generalist ones trained on heterogeneous data

