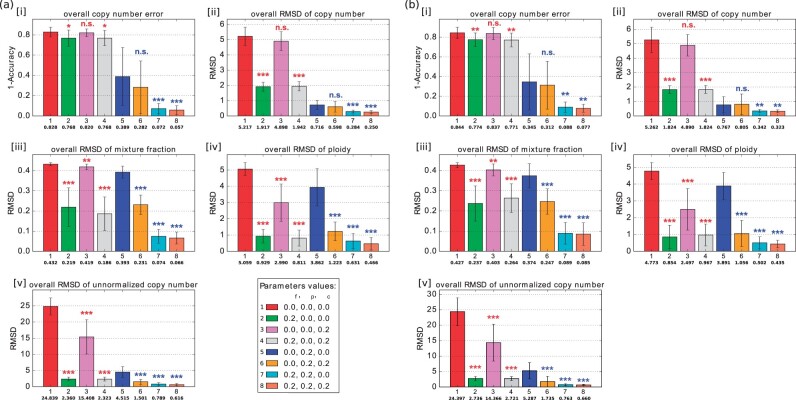
Fig. 2.
Average accuracy and RMSD of the deconvolution with ploidy change (n = 10). (a) Without noise. (b) With 10% noise. In each subplot of [i]–[v], the bar plot shows the average error (1 - accuracy) of copy number, average RMSD of copy number, average RMSD of mixture fraction, average RMSD of ploidy and average RMSD of unnormalized copy number. Each bar with a different color represents a deconvolution model with different parameter values. The number in the first row under the bar indicates a set of parameter values, the number in the second row under the bar indicates the mean for those parameter values, and the whiskers show the standard deviation. The legend at the bottom right of (a) shows the combination of parameter values corresponding to each bar of each subplot, numbered in the same order as they appear in the subplot. Each row of three numbers provides the value of mixture fraction weight αf, phylogenetic weight and copy number weight , which are regularization terms for and , respectively. 0.0 means the corresponding term was not included in the model. Statistically significant improvements from incorporating FISH data were assessed by paired sample t-test, comparing green (2), pink (3) and gray (4) bars to the NULL model [red bar (1)] and orange (6), cyan (7), coral (8) bars to the single-cell only model [blue bar (5)] (n.s.: not significant, *: P-value, **: P-value, ***: P-value)

