
Fig. 3.
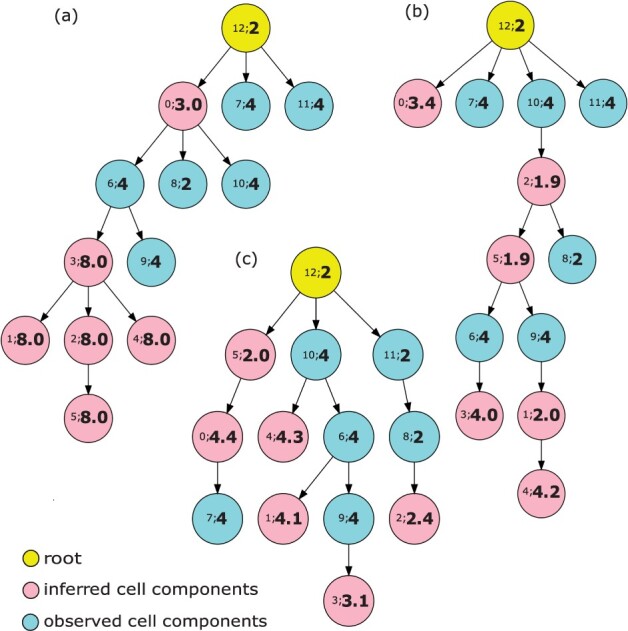
Phylogenetic trees for observed and inferred cell components on simulated data. The yellow node represents a diploid root cell, the pink nodes are inferred cell components and the light blue nodes are observed cell components. The number pair inside each node provides . (a) is the result from the model only including the term, (b) from the model including and and (c) from the complete model