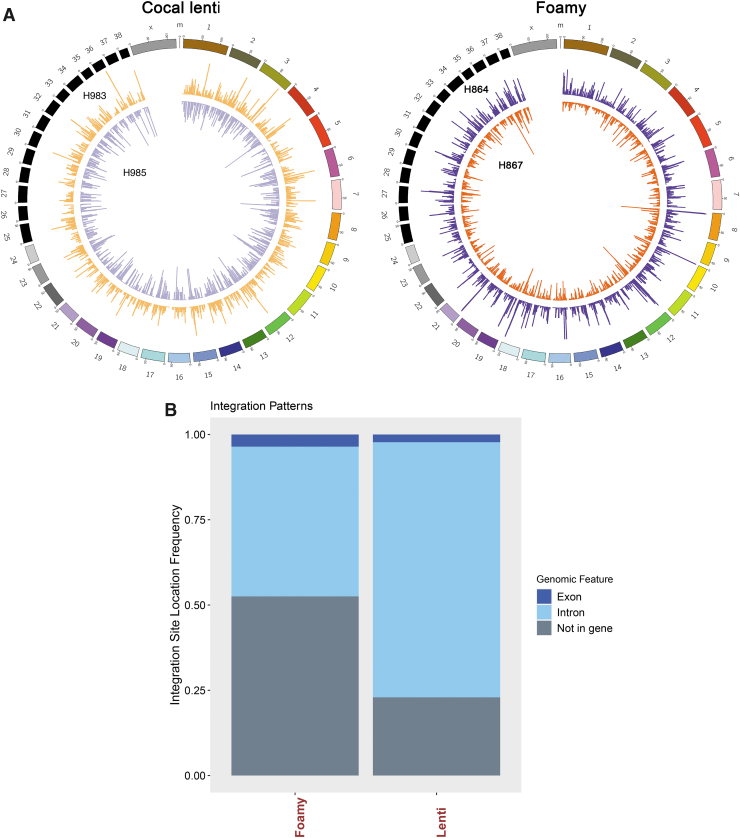
Figure 6.
Comparative ISA (ISA in cocal LV and foamy vector-treated dogs) indicates random integration pattern. (A) Circos plot depicting integration sites across the dog genome and comparison of cocal-LV-hPGK-EGFP-γC-treated animals (H983 and H985, left circos plot) with that of FV-hPGK-mCherry-γC-treated (H864 and H867, right circos plot) animals. Each chromosome is represented on the exterior of the ring and is broken down into sequential bins, each 100 kB in size. The total number of unique integrations occurring within each bin is represented by the height of histogram bars. (B) Bar chart depicts the percentage of integration sites found within an exon, intron, or not in a gene for foamy- and cocal LV vector-treated dog. The total integrations plotted for foamy are 12,471 and for cocal LV dogs are 5,244.

