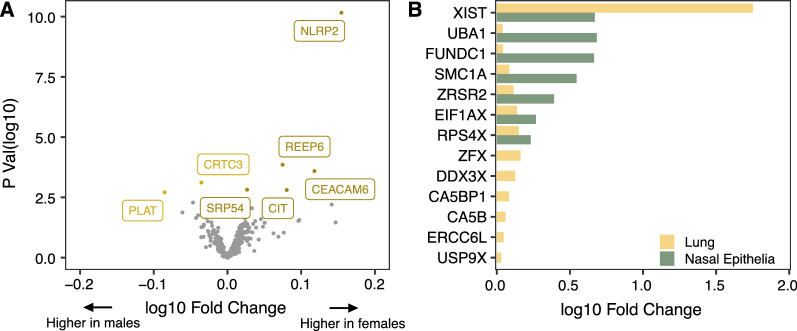
Fig. 2.
Male–female differences in expression observed in autosomal and X-linked genes. A Volcano plot of the differential expression analysis between males and females in autosomal genes (lung). For each gene, p values obtained from the Welch t tests are plotted on the y axis, and the log fold change in gene expression between sexes is plotted on the x axis. Genes that met the statistical cutoff of FDR < 0.05 are labeled. Among the five statistically significant genes (NLRP2, REEP6, CEACAM6, CIT, and SRP54) which showed decreased expression in males compared to the females, NLRP2 exhibited the highest change in expression. B Bar plot of log fold changes for X-linked genes which were differentially expressed between the sexes in the nasal epithelia and lung. An overlap of five sex-specific genes was observed between the two tissues, of which, XIST showed the highest log fold change in expression in females compared to males

