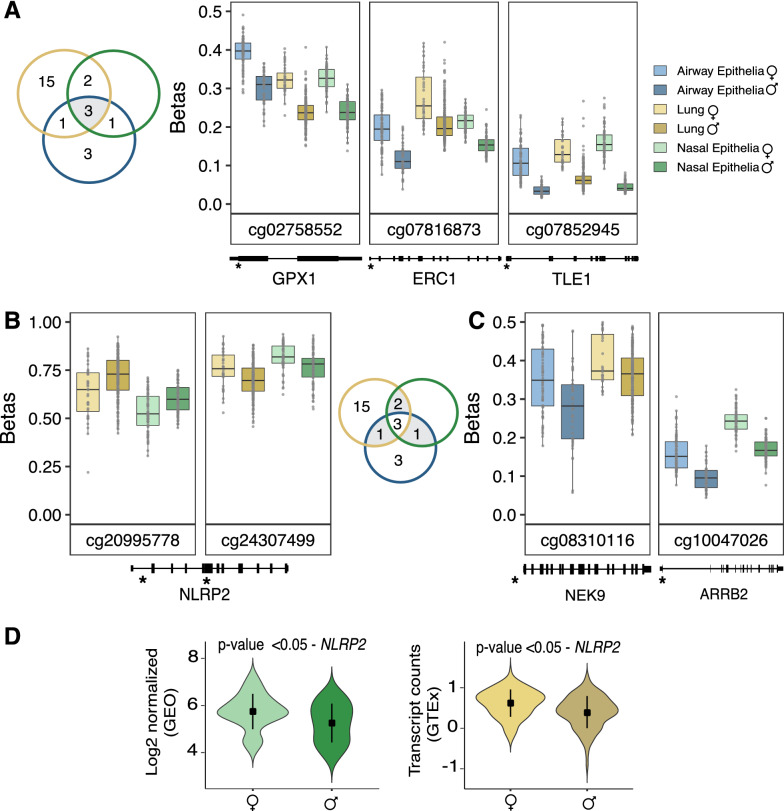
Fig. 3.
Male–female differences in DNA methylation and gene expression observed in autosomal genes. In the boxplots, unadjusted DNA methylation values (β) were plotted on the y axis against the CpG sites on the x axis, and genomic positions of the CpG sites were plotted below the respective plots. The overlap of CpG sites across the tissues is shown in the Venn diagrams. In the violin plots, expression was quantified as log2 normalized values for nasal epithelia (GEO) and for the lung data set (GTEx), expression was measured as transcript counts. A Boxplots of the three robust CpG sites (cg02758552, cg07816873, cg07852945) which were differentially methylated by sex across the infection relevant tissues. Specifically, at these CpG sites, males exhibited a decreased DNA methylation profile compared to the females. B, C Boxplots of CpG sites that showed a similar male–female differential DNA methylation pattern in at least two of the infection relevant tissues. D Violin plots of NLRP2 expression differences between males and females in nasal epithelia and lung, respectively

