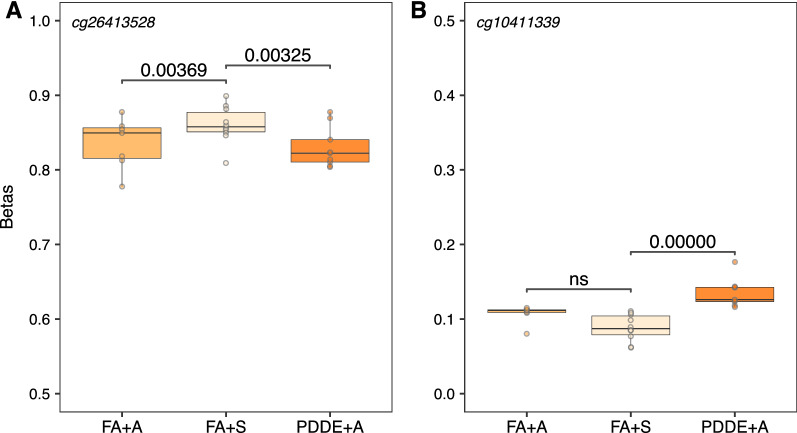
Fig. 6.
DNA methylation patterns in response to environmental exposure to pollutants in bronchoalveolar lavage. Box plots of unadjusted DNA methylation values (β) on the y axis against the exposure groups on the x axis. A At cg26413528, both the allergen exposed group (FA + A) and the particle-depleted diesel exhaust (PDDE + A) group showed a decreased DNA methylation profile compared to the control group (corrected p value < 0.05). B At cg10411339, only the particle-depleted diesel exhaust (PDDE + A) group showed an increased DNA methylation profile compared to the control group (corrected p value < 0.05)

