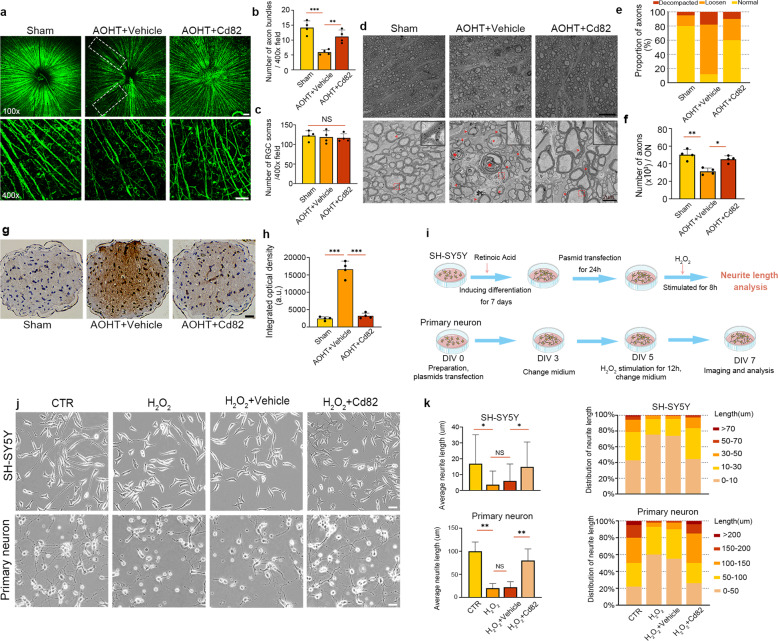
Fig. 4. CD82 overexpression protected optic nerve from axonal degeneration induced by AOHT.
a Immunostaining of Tuj1 in retina flat mount to show RGC axons in groups of Sham and 2d post-AOHT with or without CD82 overexpression. Top panel for images of 100×, scale bar, 100 μm; Bottom panel for images of 400×, scale bar, 50 μm. The white dashed box indicating sparse axon distribution. Statistical analysis of Tuj1+ axon bundles (b) and Tuj1+ RGCs (c) shown in the bottom panel of (a). The data were expressed as mean ± S.E.M., five nonoverlapping images were chosen for statistical analysis of each retina, n = 4 retinas. d Electron microscopy images from optic nerve cross-section showing axon damage in groups of CTR and 2d post-AOHT with or without CD82 overexpression. Top panel, scale bar, 10 μm; Bottom panel, scale bar, 2 μm. Red arrowheads denoting delaminated myeline. Red asterisks representing spiral degeneration of axons. The right upper corner in each picture showing the magnification of myelin sheath in red dashed boxes. Statistical analysis of axon proportions with normal, loosen, or decompacted myelin (e) and the number of myelinated axons per ON (f) as shown in (d). Five nonoverlapping images were chosen for statistical analysis of each individual, n = 4 optic nerves. g Immunohistochemical staining of Aβ in optic nerve cross-section grouped as in (a). Scale bar, 20 μm. h Statistical analysis of integrated optical density shown in (g), n = 4 optic nerves. i Schematic drawing of the major procedures in neurite outgrowth analysis for SH-SY5Y cells and primary hippocampal neurons. j Representative images showing neurite outgrowth of SH-SY5Y cells and primary hippocampal neurons in control group and H2O2 groups with or without Cd82 plasmid transfection. Scale bar, 20 μm. k Statistical analysis of neurite length shown in (i). Twenty nonoverlapping fields of view chosen for analysis in each group for one experiment, n = 200 cells. Statistical tests in (b), (c), (f), (h) and (k) using one-way ANOVA, *P < 0.05, **P < 0.01, ***P < 0.001.

