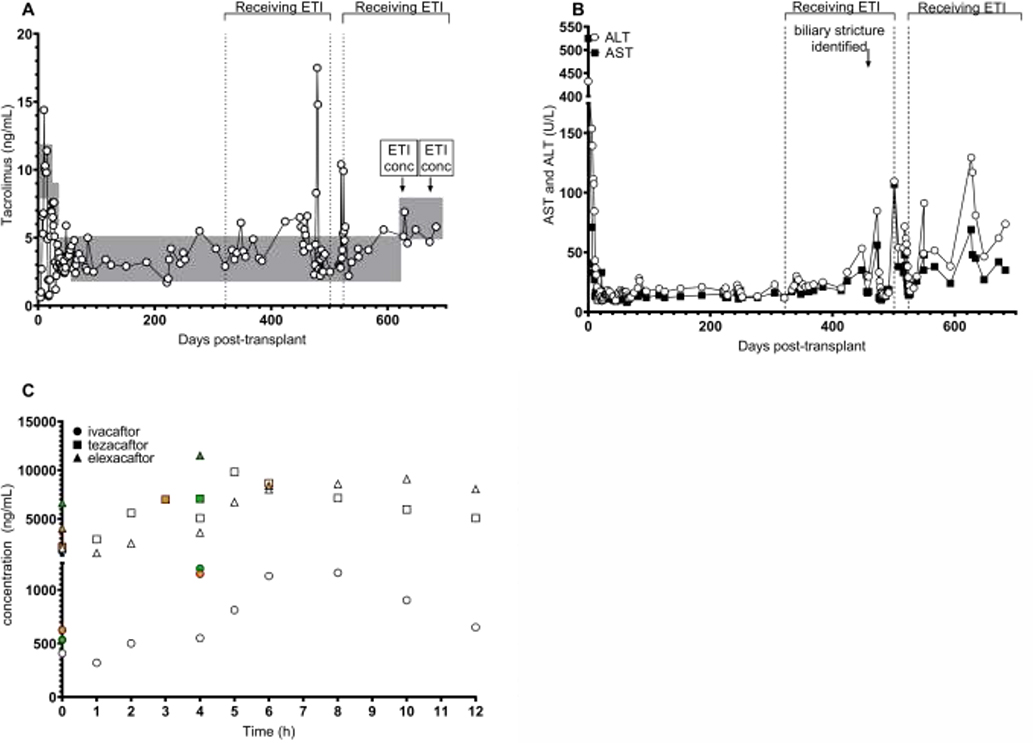
Figure 1. Drug monitoring after liver transplant.
A. Tacrolimus concentrations were obtained clinically after transplant for routine monitoring. Gray boxes indicate desired target blood exposure during each period after transplant. “ETI conc” indicates timing of blood collection for compound concentrations. ETI brackets and vertical dotted lines indicate time on and off modulator therapy. B. AST and ALT tests were obtained clinically for monitoring. C. Elexacaftor, tezacaftor, and ivacaftor concentrations were quantitated from plasma by mass spectrometry similar to previous reports.(6) White open data points indicate first ETI concentrations measured sequentially over 12 hours. Green data points indicate sparse sampling at 0 and 4 hours for the second ETI concentration assessment. Orange data points represent the steady-state minimum and maximum concentrations as reported by the manufacturer. (2) The time of maximum concentration for each compound varies: median (range) = ivacaftor 4h (3–6); tezacaftor 3h (2–4); elexacaftor 6h (4–12). One green point is hidden behind orange square at time=0.

