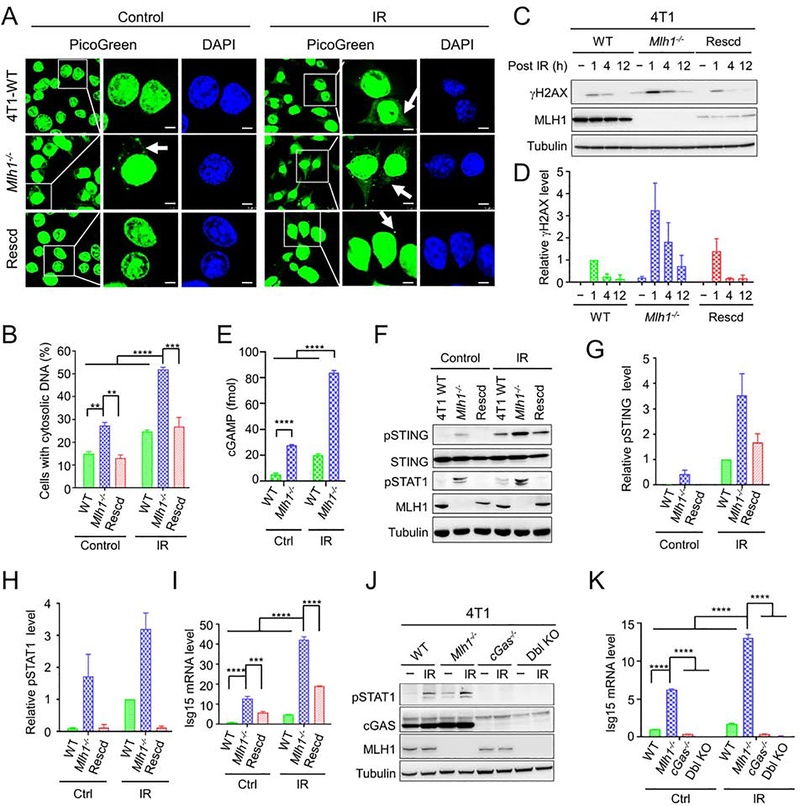
Figure 1. MLH1 deficiency activates innate immune signaling pathway.
(A) Detection of cytosolic DNA in WT, Mlh1−/− 4T1 and Mlh1-rescued (Rescd) 4T1 cells treated with or without IR, as indicated. DNA was detected using the PicoGreen fluorescence dye selectively binding dsDNA. Arrows point to cytosolic DNA. (B) Percentage of cells displaying cytosolic DNA with and without IR treatment. (C) Western blot analysis showing prolonged γH2AX in Mlh1−/−, but not in WT and Mlh1-rescued 4T1 cells after IR treatment. (D) Quantification of relative γH2AX levels in various 4T1 cells. (E) Increased production of cGAMP in Mlh1−/− 4T1 cells. (F) Western blots showing enhanced phosphorylation of STING (pSTING) and STAT1 (pSTAT1) induced by IR in Mlh1−/− cells. (G) and (H) Quantification of relative levels of pSTING and pSTAT1, respectively. (I) qRT-PCR analysis showing increased production of Isg15 in Mlh1−/− cells. (J) and (K) Western blots and qRT-PCR, respectively, showing that immune signaling induced by MLH1 deficiency depends on cGAS. When present, “−” indicates untreated cells. Data represent the mean ± SEM of 3 independent experiments (B, D, G and H) or 3 replicates (E, I and K). P value was calculated using one-way ANOVA. **, p<0.01; ***, p<0.001; and ****, p<0.0001. See also Figure S1.

