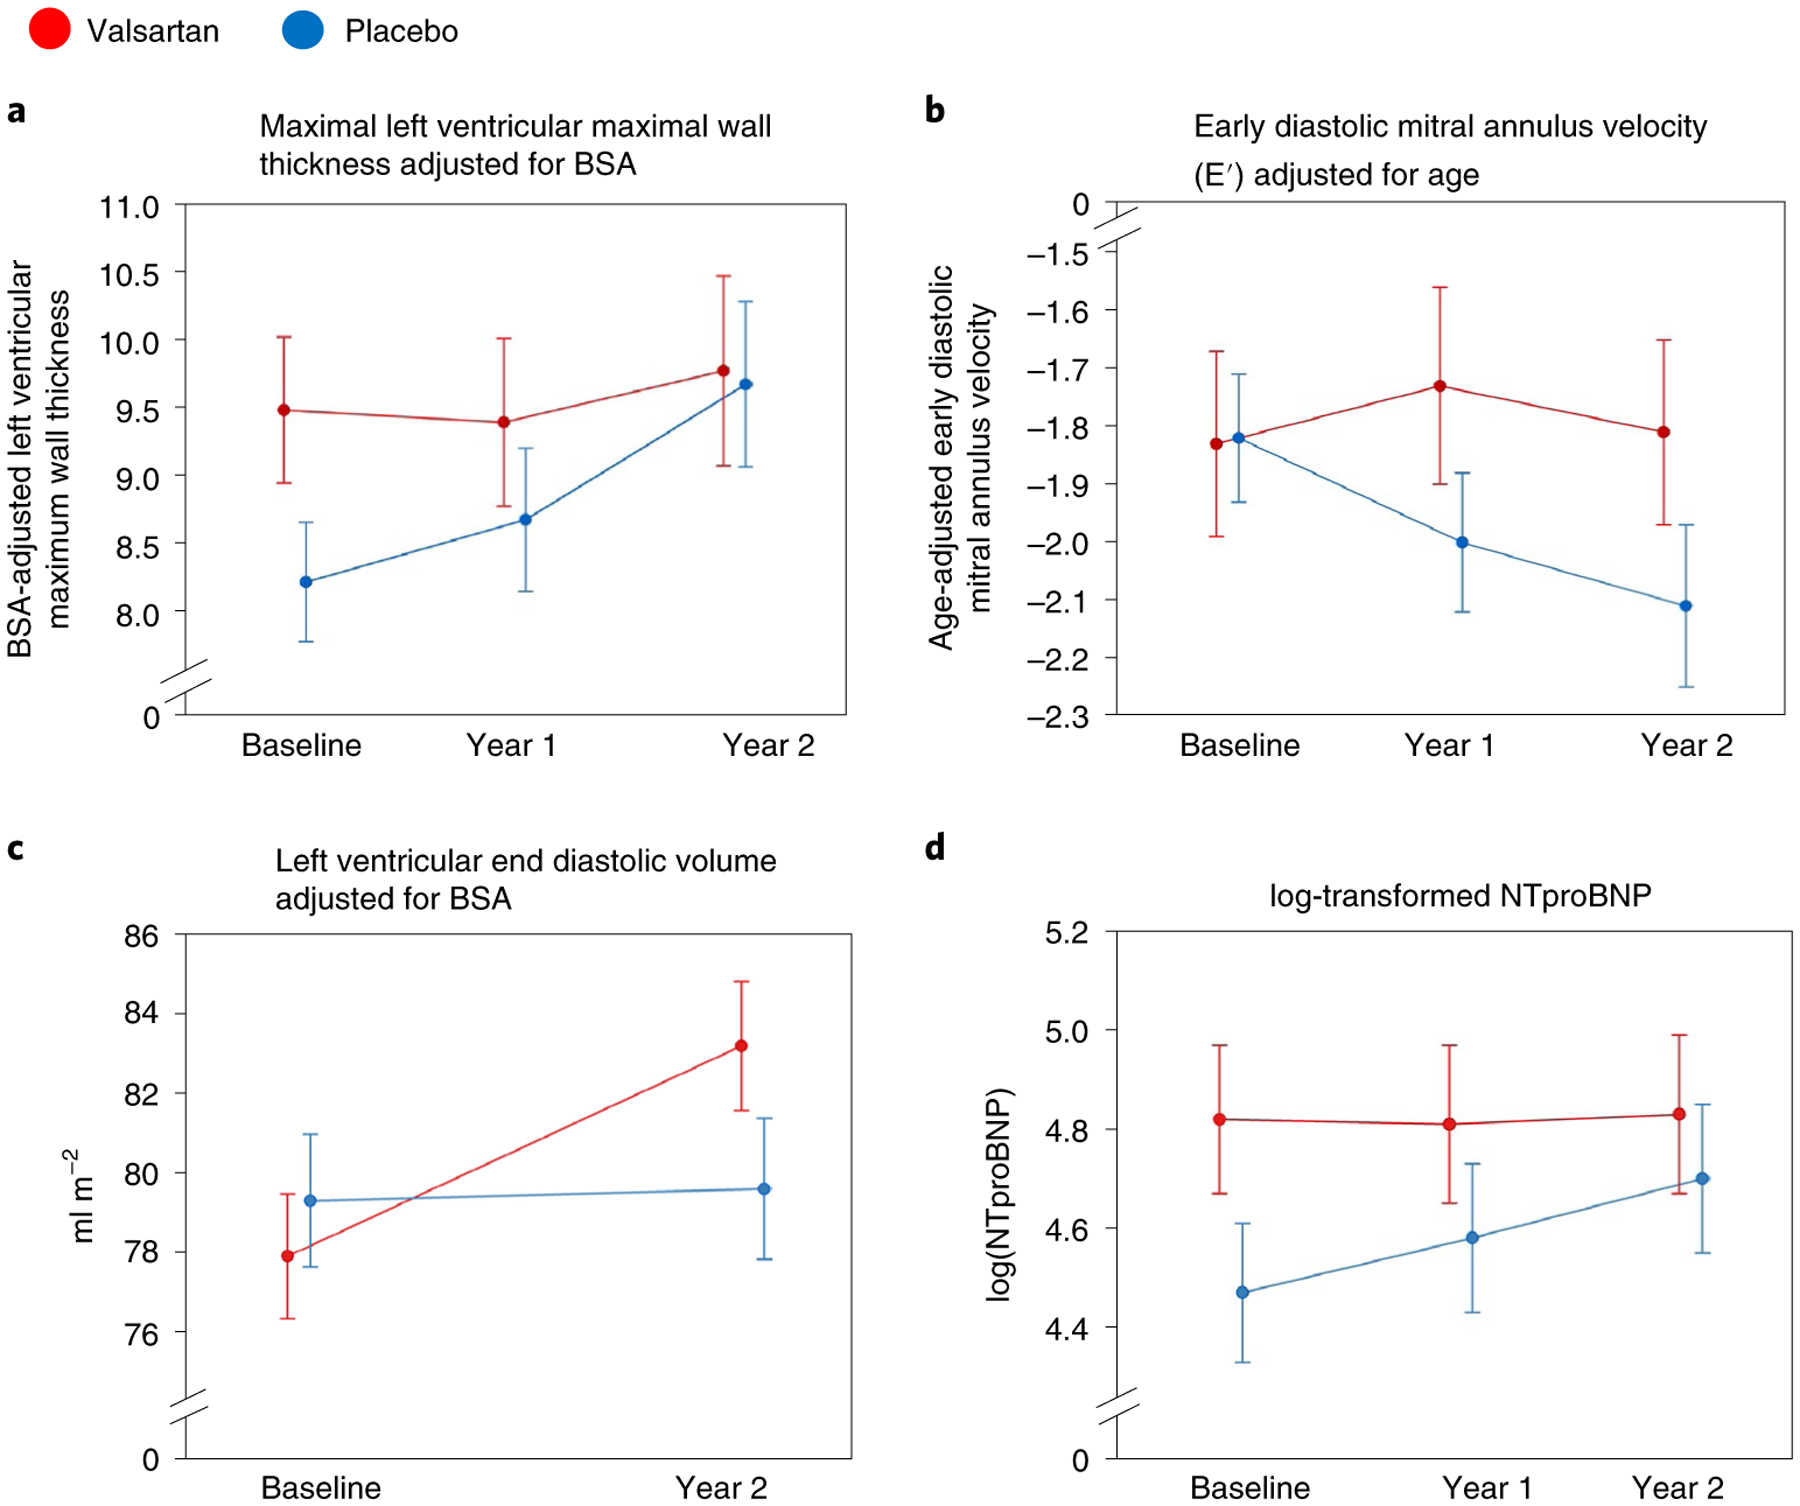
Fig. 3 |. Longitudinal changes in key components of the primary composite outcome.

Values at baseline, year 1 and year 2 (end of study) for the valsartan (n = 88; red) and placebo (n = 90; blue) groups are presented as mean and standard error of the mean. a–d, Shown are data for BSA-adjusted z-score for maximal LV wall thickness (a), age-adjusted tissue Doppler diastolic velocity (E′) (b), BSA-indexed LV end diastolic volume, measured by CMR imaging performed only at baseline and year 2 (echo measures substituted for both time points if participants could not undergo either baseline or year 2 CMR imaging) (c) and log-transformed NTproBNP serum levels (d).
