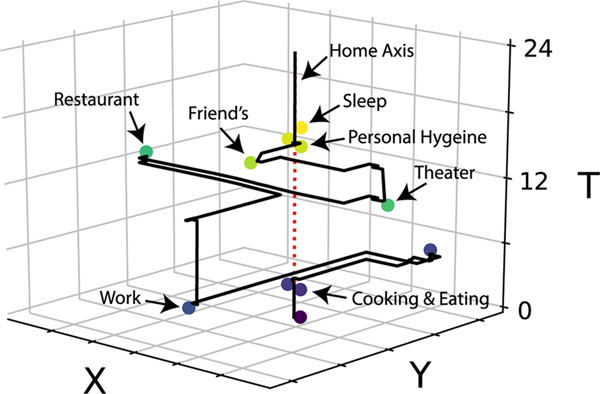
Figure 1.
An example activity trajectory, which tracks the spatiotemporal path of a person through a 24 hour period. Time increases along the vertical axis, while the momentary position is captured in the XY plane. Each dot represents the start of a new activity. The dashed line represents the home axis, where the majority of personal activities are expected to occur.

