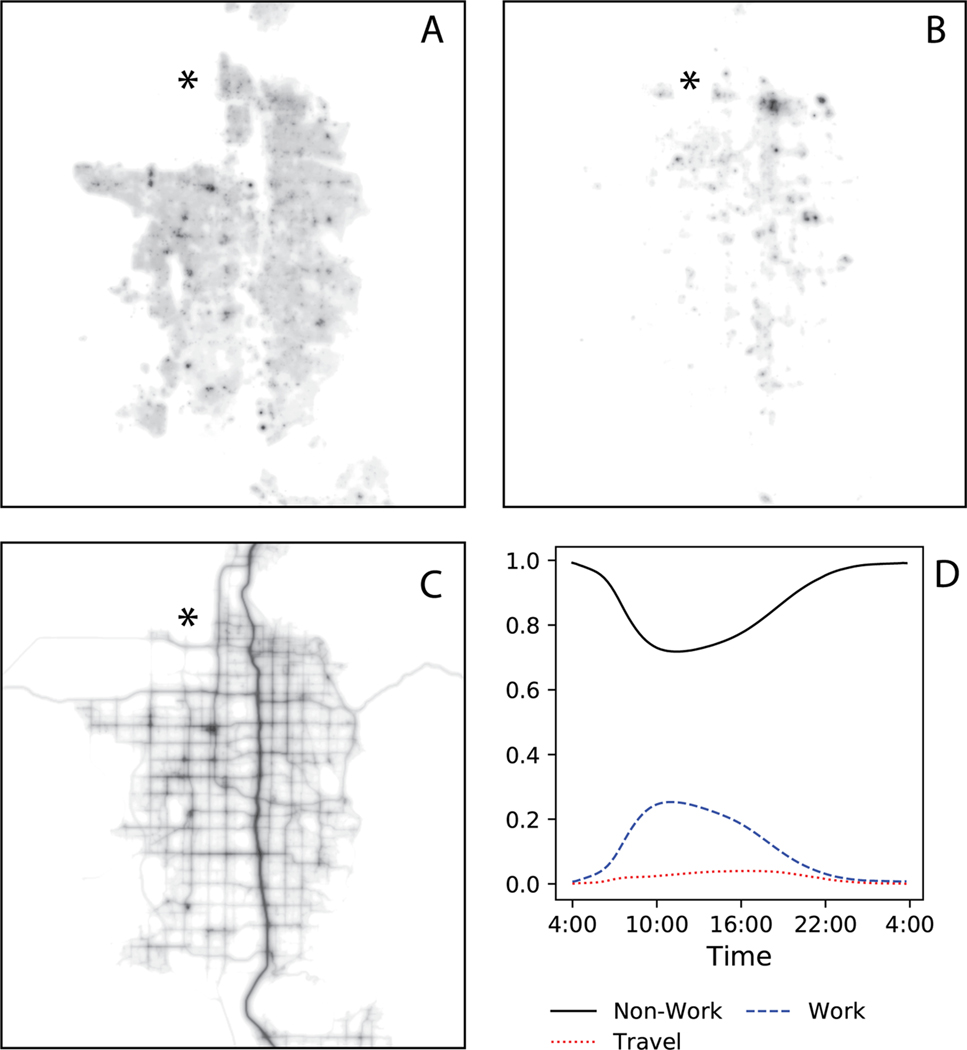
Figure 6.
The spatiotemporal distribution of human activities for the Salt Lake County Metropolitan area. Panels A-C show the geospatial distribution at noon on a typical weekday for Non-Working, Working, and Travelling activities, respectively. Each distribution is scaled independently and should not be compared directly. Panel D show the proportion of each activity category throughout the day.

