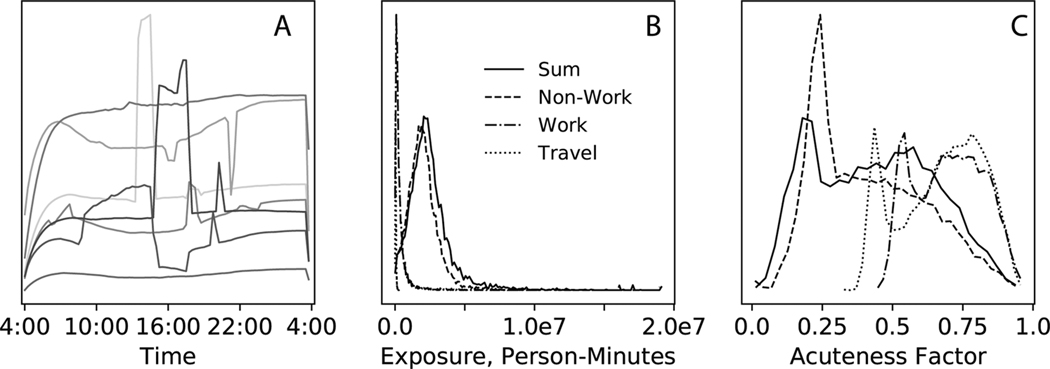
Figure 8.
Exposure characteristics for the simulated population. Panel A shows a few example exposure profiles. The shapes of the profiles vary substantially and can be punctuated by abrupt changes in exposure. Panel B shows the distribution of total exposures in terms of person minutes, along with the distributions of relevant sub categories. Although work and travel activities have a smaller time contribution, we expect the health effects of actual pollution from these activities to be outsized in comparison to non-work activities. Panel C shows the distribution of acuteness factors, which is calculated by dividing the expected value of the exposure by the maximum value. A higher acuteness factor means that the total exposure is concentrated into a one or more high exposure events.

