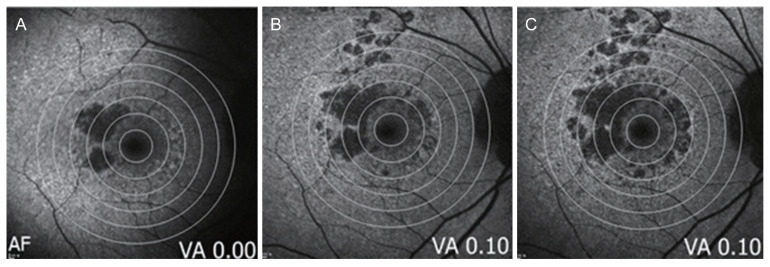
Fig. 2.
A serial fundus autofluorescence image of subject with geographic atrophy. Geographic atrophy area was measured based on fundus autofluorescence image. Corresponding image was divided by six circular areas at increase of 1 mm from foveal center. Progression of atrophic region was observed on zone 1 through zone 6 at yearly follow-up images. (A) Baseline, (B) 1-year follow-up, and (C) 2-year follow-up. AF = autofluorescence; VA = visual acuity.

