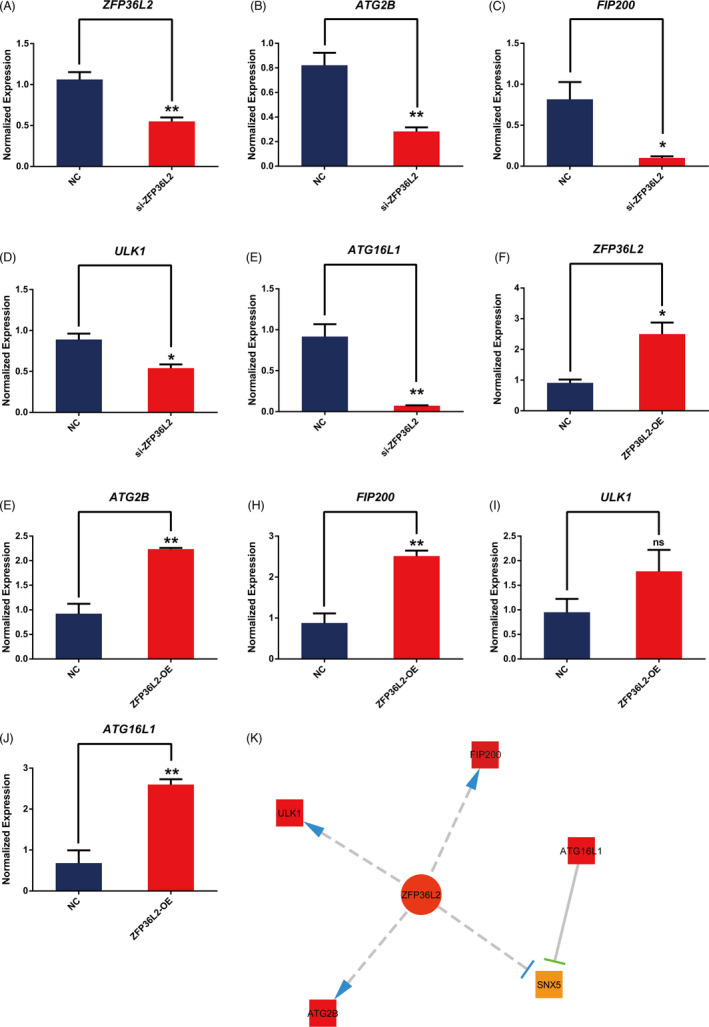
FIGURE 2.

Effects of ZFP36L2 on autophagic gene mRNA expression. (A–E) The expression of ATG2B, FIP200, ULK1 and ATG16L1 in NC and si‐ZFP36L2 groups quantified by RT‐qPCR. All data were representative of at least three independent experiments. *p < 0.05, **p < 0.01, ***p < 0.001 vs the NC group. (F–J) The expression of ATG2B, FIP200, ULK1 and ATG16L1 in NC and ZFP36L2‐OE groups quantified by RT‐qPCR. All data were representative of at least three independent experiments. *p < 0.05, **p < 0.01, ***p < 0.001 versus the NC group. (K) Key autophagic genes related to ZFP36L2 analysed through the network
