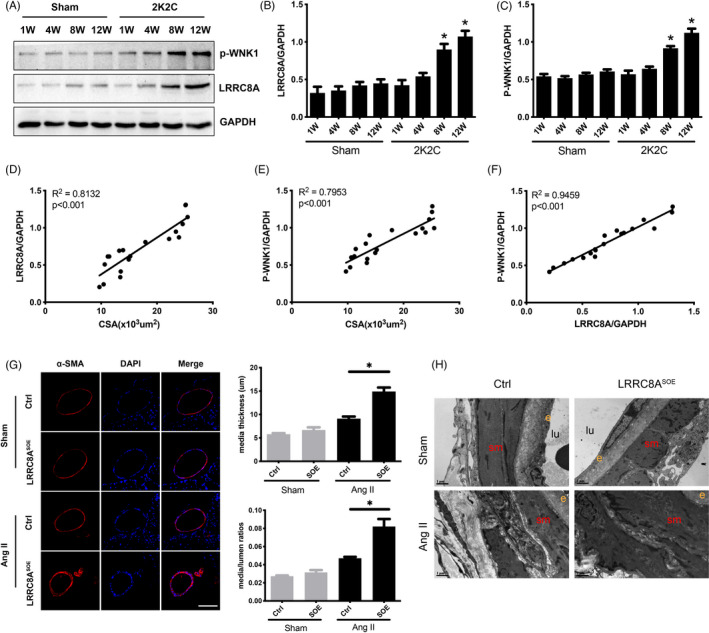
FIGURE 6.

Overexpression of LRRC8A in smooth muscle cells exacerbates hypertension‐induced cerebrovascular vascular remodeling. (A–C) Representative western blot images (A) and the respective quantification graphs (B, C) showing the expression of LRRC8A and p‐WNK1 in basilar artery from 2k2c renal hypertension model at the indicated time points (n = 3, *p < 0.05 VS Sham). (D) Correlation between the relative expression of LRRC8A and medial cross‐sectional area (CSA) of basilar artery from 2k2c renal hypertension model. (E) Correlation between the relative expression of p‐WNK1 and medial cross‐sectional area (CSA) of basilar artery from 2k2c renal hypertension model. (F) Correlation between the relative expression of p‐WNK1 and the relative expression of LRRC8A from 2k2c renal hypertension model. (G) Representative images of α‐SMA staining and quantification graphs of basilar artery media thickness and media/lumen ratio in LRRC8A smooth muscle overexpressing (LRRC8ASOE) mouse with or without Ang II infusion (n = 5, *p < 0.05). (H) The electron microscopy images of basilar artery from LRRC8ASOE mouse with or without Ang II infusion, sm, smooth muscle; e, endothelium; lu, lumen; Scale: 1 μm
