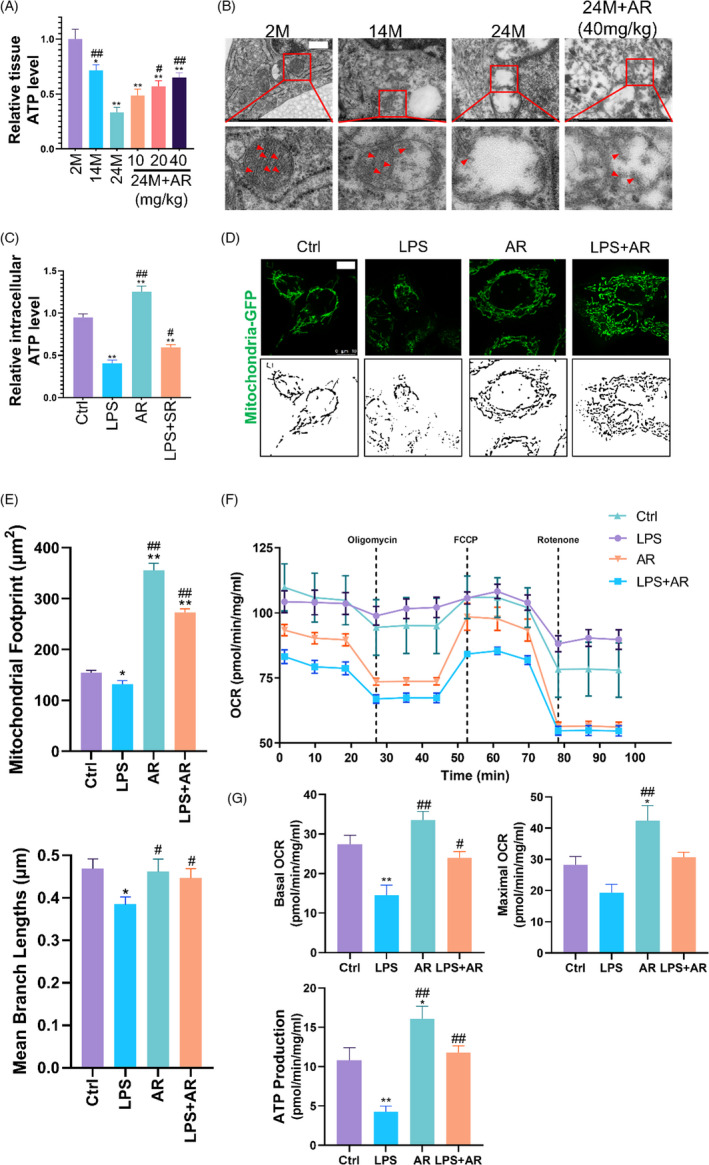
FIGURE 2.

AdipoRon Reversed the Changes in Mitochondrial Morphology and Function during Skin Ageing. (A) The ATP level was detected to reflect the changes in mitochondrial function in skin samples obtained from different groups. N = 8. * p < 0.05 and ** p < 0.01 versus 2M group. # p < 0.05 and ## p < 0.01 versus 24M group. (B) Electron microscopy was performed to reflect the ultrastructural changes in ESCs of each group of mice. The box area below each photomicrograph shows an enlarged version of the red square. The red arrows indicate mitochondrial cristae. N = 8. Scale bar, 500 nm. (C) The ATP level was detected to reflect the changes in mitochondrial function in ESCs with different treatments. N = 3. * p < 0.05 and ** p < 0.01 versus control group. # p < 0.05 and ## p < 0.01 versus LPS group. (D) and (E) Labelled by CellLight Mito‐GFP, the mitochondrial morphology changes of ESCs in different treatment groups were observed. Skeletonized images were listed below to show the integrity of mitochondria. Scale bar, 10 μm. N = 3. * p < 0.05 and ** p < 0.01 versus control group. # p < 0.05 and ## p < 0.01 versus LPS group. (F) and (G) The mitochondrial stress test of the Seahorse assay was used to reflect changes in the mitochondrial respiratory function of ESCs. N = 5. * p < 0.05 and ** p < 0.01 versus control group. # p < 0.05 and ## p < 0.01 versus LPS group
