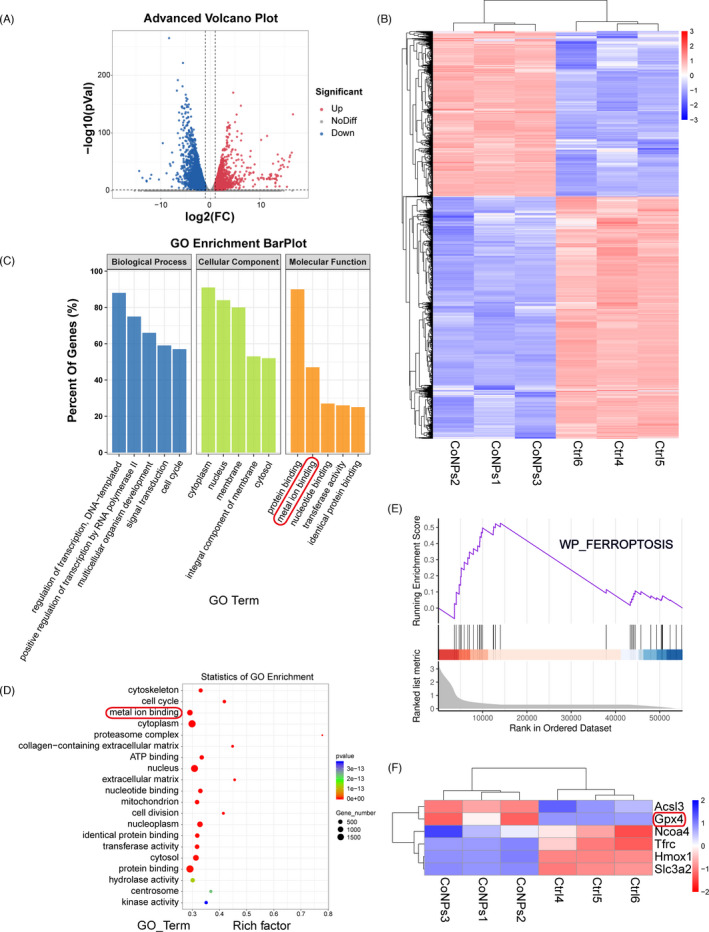
FIGURE 2.

RNA‐seq analysis revealed that CoNPs downregulated GPX4 expression in MC3T3‐E1 cells, which correlates with ferroptosis. (A) Volcano plot reveals 2358 upregulated genes and 3458 downregulated genes in MC3T3‐E1 cells after CoNPs (50 μg/ml) stimulations for 12 h. (B) Heat map and cluster analysis. (C, D) Significant pathway of GO Enrichment analysis in which metal ion binding enriched significantly. (E) Enrichment plot of Ferroptosis gene sets which were importantly differentiated between the control group and CoNPs group. (F) Heat map and cluster analysis between Ferroptosis gene sets and differential genes in which ferroptosis core regulator GPX4 decreased significantly
