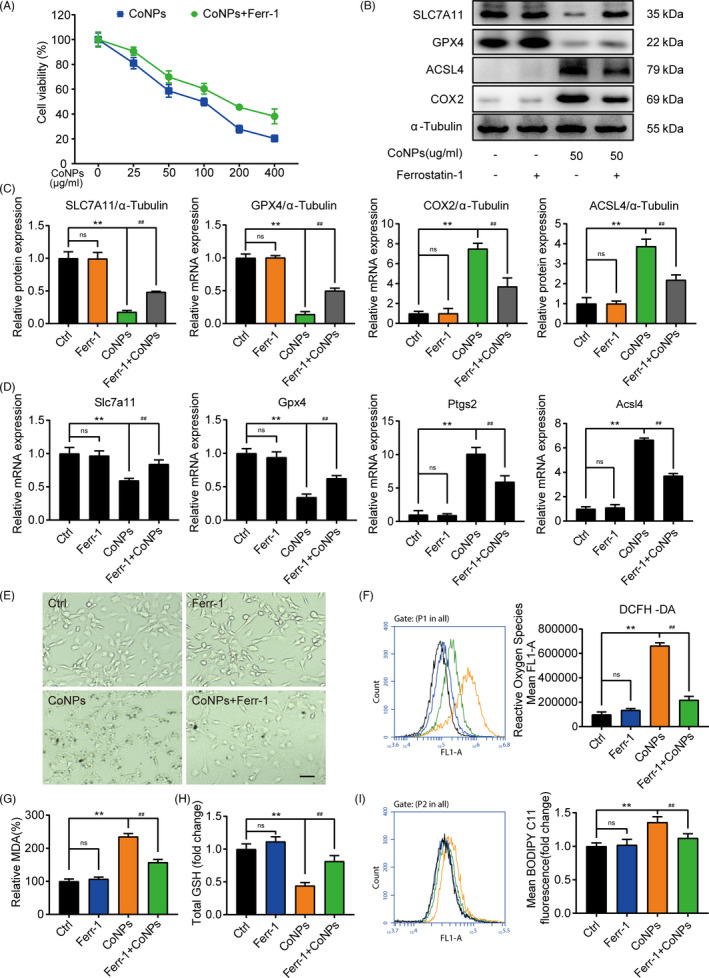
FIGURE 5.

Ferrostatin‐1 protected osteoblasts against ferroptosis induced by CoNPs in vitro. (A) Osteoblasts were treated with ferrostatin‐1 (1 μM/ml) for 12 h before treatment with CoNPs for 24 h. Cell viability was observed by CCK‐8. (B) Western blots performed after osteoblasts being stimulated with indicated treatment. (C) The quantification of the western blot bands shown in (B). (D) Relative mRNA expression in each group. (E) Light microscopic changes of MC3T3‐E1 cells in each group. Scale bar: 100 μm. (F) ROS generation was demonstrated by flow cytometry with DCFH‐DA (10 mM) in each group. (G) Lipid peroxide MDA level in each group. (H) The GSH level in each group. (I) Cell lipid peroxidation was detected by BODIPY 581/591 C11 staining in each group. *, # indicates p < 0.05, **, ## indicates p < 0.01, ns indicates not significant
