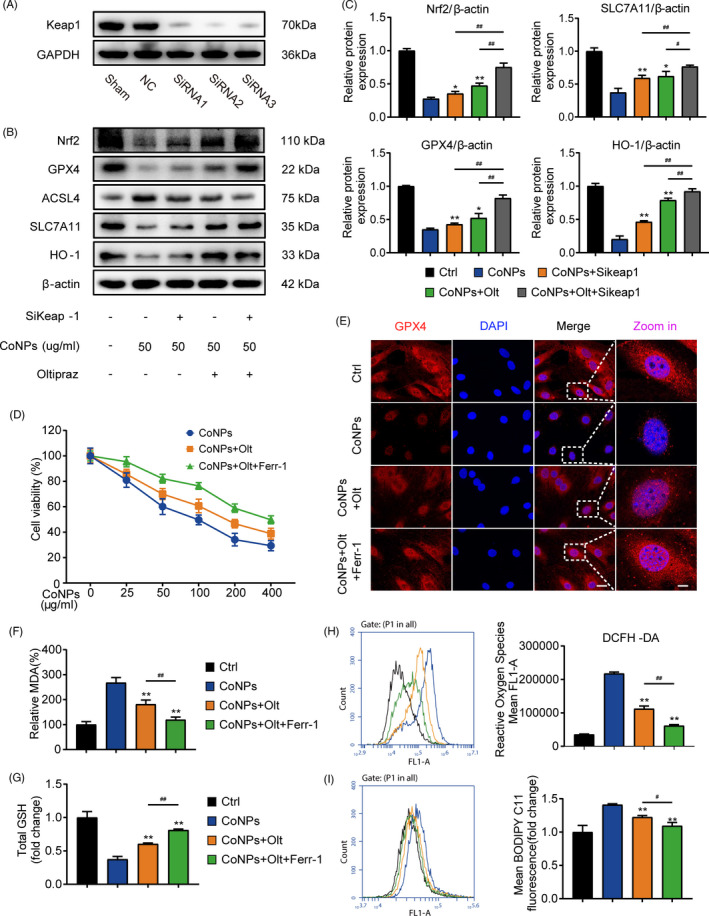
FIGURE 7.

Oltipraz suppresses ferroptosis via activation of the Nrf2‐ARE signalling pathway. (A) Western blots performed after cells were incubated with sham, siControl, and siKeap1. (B) Western blots performed after MC3T3‐E1 cells were incubated with indicated treatment. (C) The quantification of the western blot bands shown in (B). (D) Cell survival was determined by CCK‐8. (E) Immunofluorescence of GPX4 expression in MC3T3‐E1 treated with PBS (Control), CoNPs, CoNPs + Olt, and CoNPs + Olt + Ferr‐1. Scale bar: 20 μm (before Zoom in); 2 μm (after Zoom in). (F) The lipid peroxide MDA level in each group. (G) The GSH level in each group. (H) ROS generation was demonstrated by flow cytometry with DCFH‐DA (10 mM) in each group. (I) Cell lipid peroxidation was detected by BODIPY 581/591 C11 staining in each group. *, # indicates p < 0.05, **, ## indicates p < 0.01, ns indicates not significant
