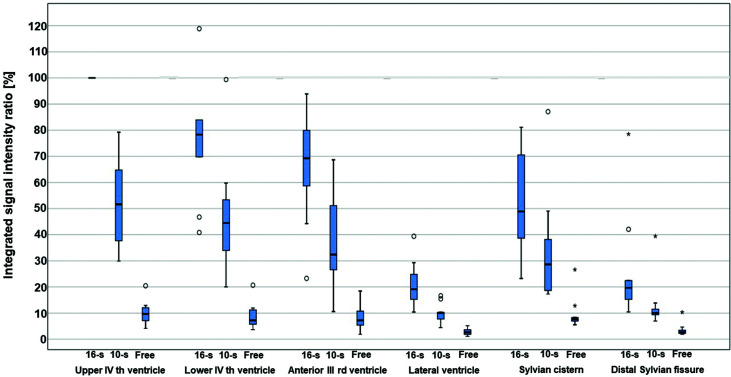
Fig. 3.
Percentile changes of signal intensity in each region. Assuming that the value of the integrated signal intensity ratio of a single respiratory cycle MR signal decreases in accordance with CSF velocity, its integral therefore represents a quantity that corresponds to the integral of the velocity as an expression of CSF displacement. In the figure, values are expressed with reference to the lowest signal in the upper fourth ventricle, which is considered as 100%. The values are thus lower for free breathing, in which the signal changes are smaller. The following maximal extreme values (⋆) are not shown in this figure: 184% at the lower fourth ventricle, 148% at the anterior third ventricle, and 170% at the proximal Sylvian fissure. 10-s: 10-second cyclic task, 16-s: 16-second cyclic task, free: free-breathing, ○: outlier, ⋆: maximal extreme value, MR: magnetic resonance, CSF: cerebrospinal fluid.

