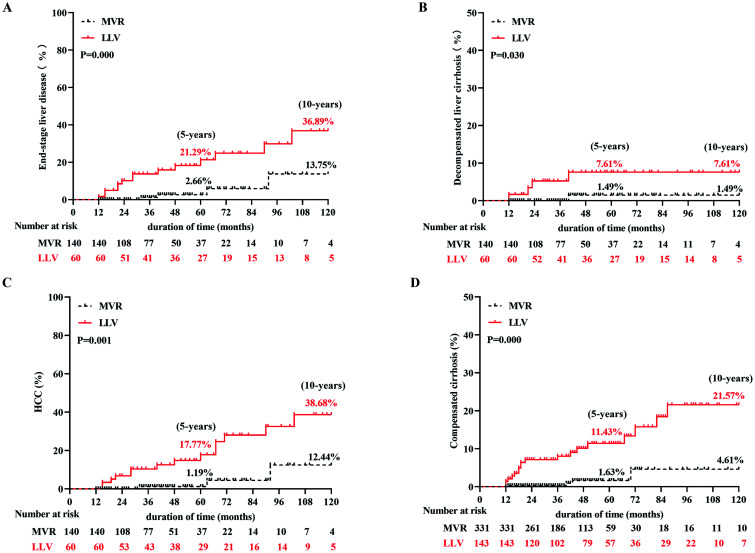
Fig. 2. Cumulative incidence rates of HCC in the high-risk group of four HCC risk models.
(A) HCC in the CU-HCC model. (B) HCC in the GAG-HCC model. (C) HCC in the PEACH-B model. (D) HCC in the PAGE-B model. LLV, low-level viremia; MVR, maintained virological response; HCC, hepatocellular carcinoma.

