
Figure 1.
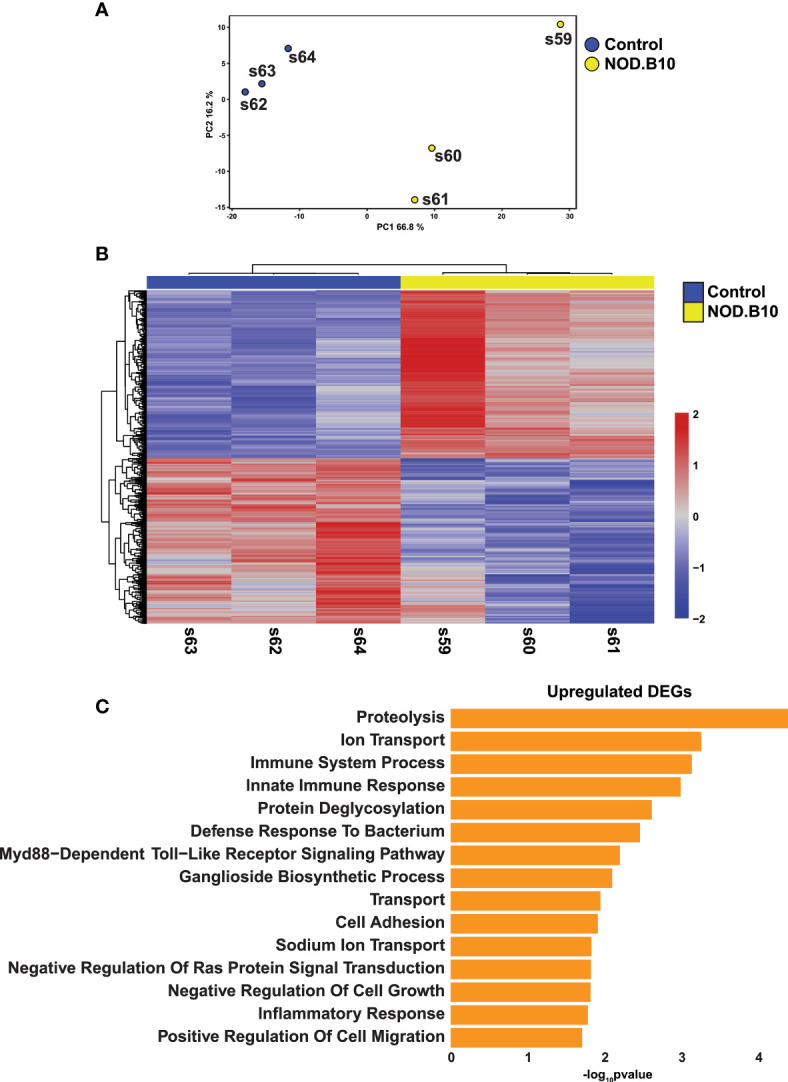
Comprehensive Transcriptomic Analysis of Submandibular Salivary Glands of NOD.B10 pSS Mice. (A) Plot shows Principal Component Analysis (PCA) coordinates for three control and three NOD.B10 mouse salivary glands. Blue and yellow circles represent control and NOD.B10 mice, respectively. (B) Heatmap visualization of differentially expressed genes (DEGs) in submandibular salivary glands of the control and NOD.B10 mice. (C) Bar plot highlighting enriched biological processes in the top 200 upregulated DEGs identified in panel (B) above.