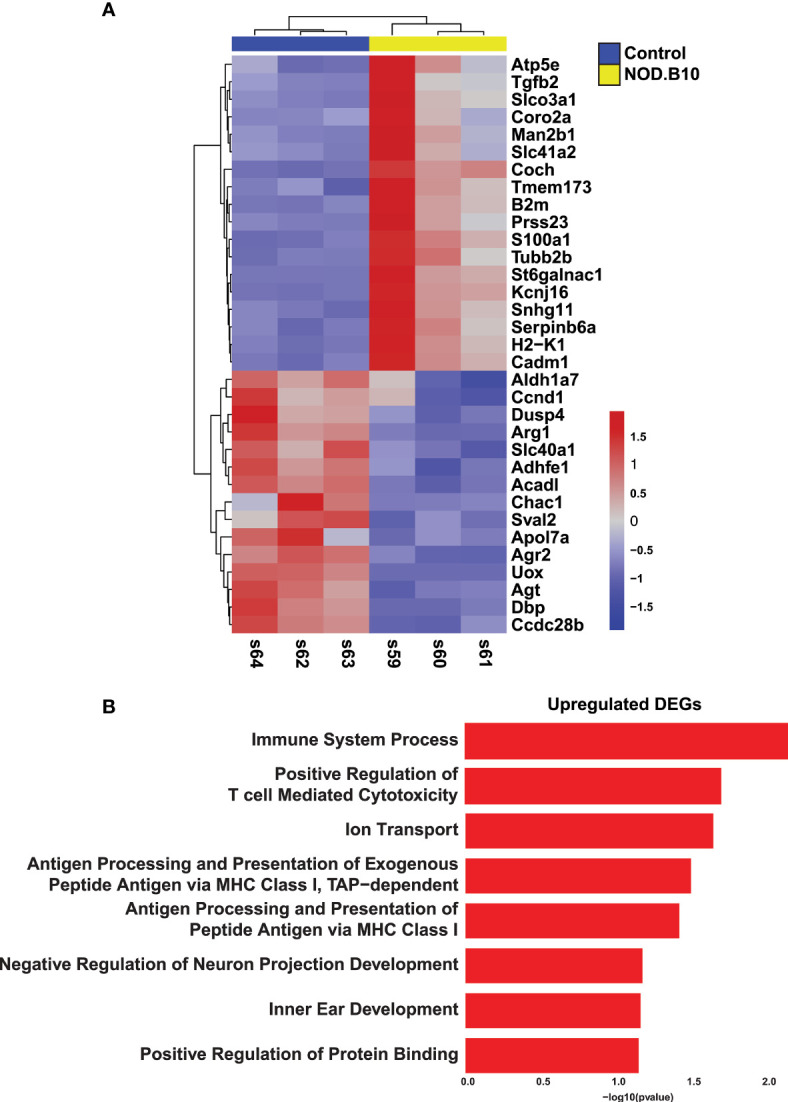
Figure 2.

Comparative Analysis of Sjögren’s Syndrome Mouse Models. (A) Heatmap visualization of the common 33 overlapping genes identified in the RNA-seq datasets described here (Horeth et al.) and the Nguyen et al. (56) microarray dataset. (B) Bar plot highlights the biological processes enriched in the common 18 upregulated genes identified in panel (A) above.
