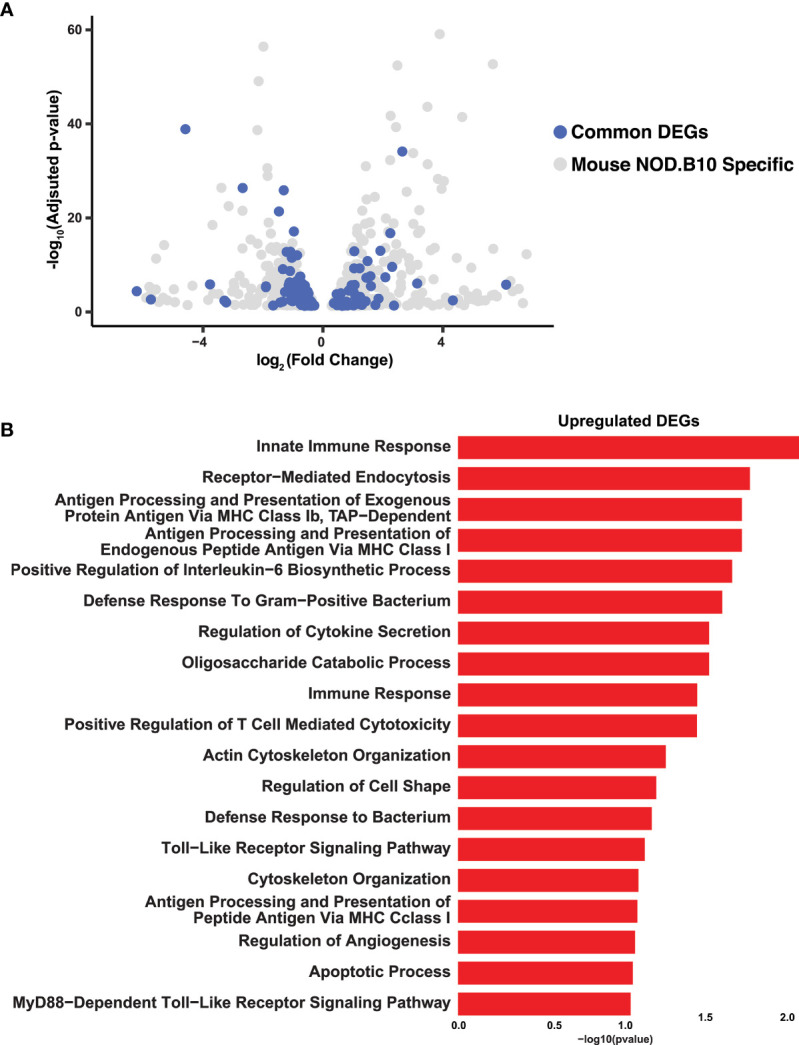
Figure 3.

Integrated Analysis of Mouse and Human Sjögren’s Syndrome Datasets. (A) Volcano plot shows the distribution of statistically significant upregulated and downregulated DEGs in NOD.B10 SMGs (grey dots) and common DEGs (blue dots) between mouse and human SS. (B) Bar plot highlights the biological processes enriched in the common upregulated DEGs identified between the NOD.B10 and human pSS datasets.
