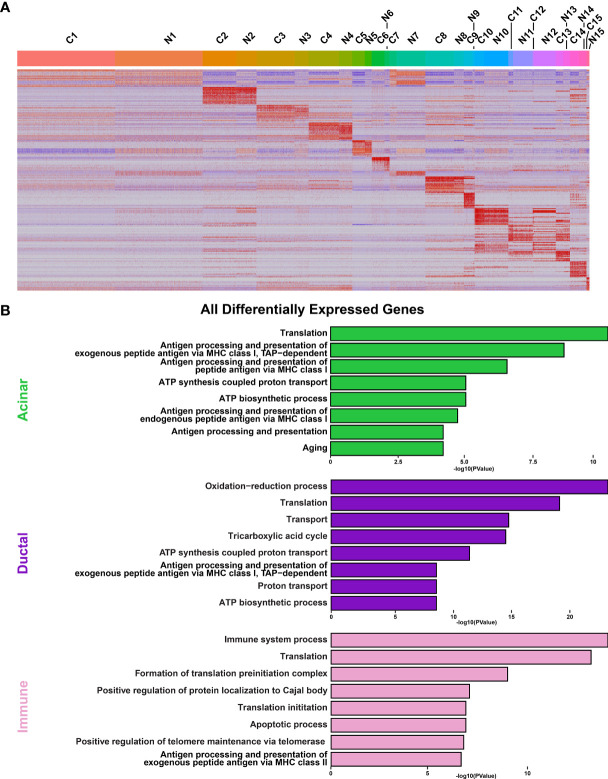
Figure 5.
Analysis of Cellular Populations as Identified by Single-cell RNA-sequencing. (A) Heatmap visualization of the top 20 differentially expressed genes in each cluster as compared with all clusters between control (C) and NOD.B10 (N) SMGs. Upper bars represent cluster assignments. (B) DAVID analysis of all DEGs in the acinar (green), ductal (purple), and immune (pink) cell clusters.

