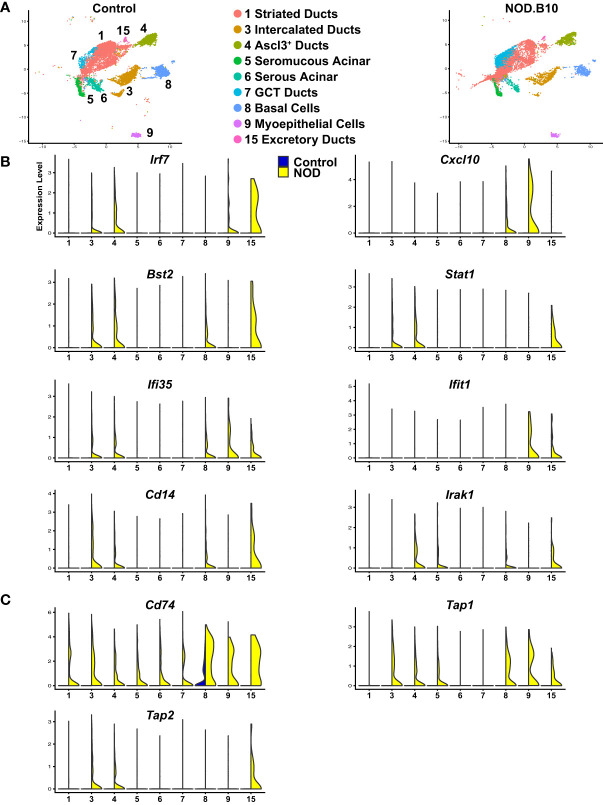
Figure 7.
Activation of Immune Responses of Mouse SS Salivary Gland Epithelial Cells. (A) UMAP visualization of the epithelial cell populations of control and NOD.B10 mouse SMGs based on hierarchical clustering analysis performed in Figure 4A . Epithelial cell cluster identities are shown. (B, C) Violin plots demonstrate expression of various immune related genes in the epithelial cell populations of control and NOD.B10 mouse SMGs.

