
FIGURE 5.
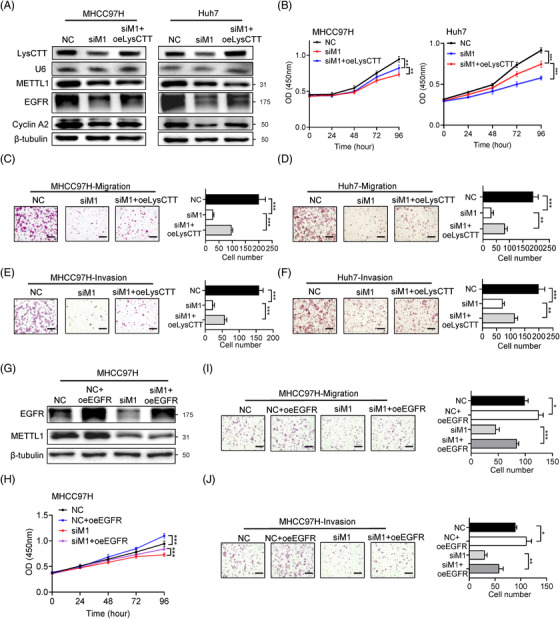
Overexpression of LysCTT and EGFR rescues HCC malignant phenotype. (A) Validation of the LysCTT, METTL1, EGFR, Cyclin A2 expression and METTL1 depletion by northern and western blots in MHCC97H and Huh7 cells. (B) CCK‐8 assay of METTL1 knockdown MHCC97H and Huh7 cells with or without overexpression of LysCTT. Data presented as mean ± SD (six technical replicates). (C, D) Representative images and quantification of migration in METTL1‐knockdown MHCC97H (C) and Huh7 (D) cells with or without overexpression of LysCTT. Scale bar, 500 μm. Data presented as mean ± SD (three technical replicates). (E, F) Representative images and quantification of invasion in METTL1‐knockdown MHCC97H (E) and Huh7 (F) cells with or without overexpression of LysCTT. Scale bar, 500 μm. Data presented as mean ± SD (three technical replicates). (G) Validation of the EGFR overexpression and METTL1 depletion by western blot in MHCC97H cells. (H) CCK‐8 assay of METTL1 knockdown MHCC97H cells with or without overexpression of EGFR. Data presented as mean ± SD (six technical replicates). (I) Representative images and quantification of migration in METTL1‐knockdown MHCC97H cells with or without overexpression of EGFR. Scale bar, 500 μm. Data presented as mean ± SD (three technical replicates). (J) Representative images and quantification of invasion in METTL1‐knockdown MHCC97H cells with or without overexpression of EGFR. Scale bar, 500 μm. Data presented as mean ± SD (three technical replicates). *p < .05, **p < .01, ***p < .001 by Student's t test, one‐way ANOVA or the Mann–Whitney U test unless specified. All the in vitro assays were biologically repeated for three times. Abbreviations: NC, negative control; oeEGFR, overexpression of EGFR; oeLysCTT, overexpression of LysCTT; siM1, siMETTL1‐1