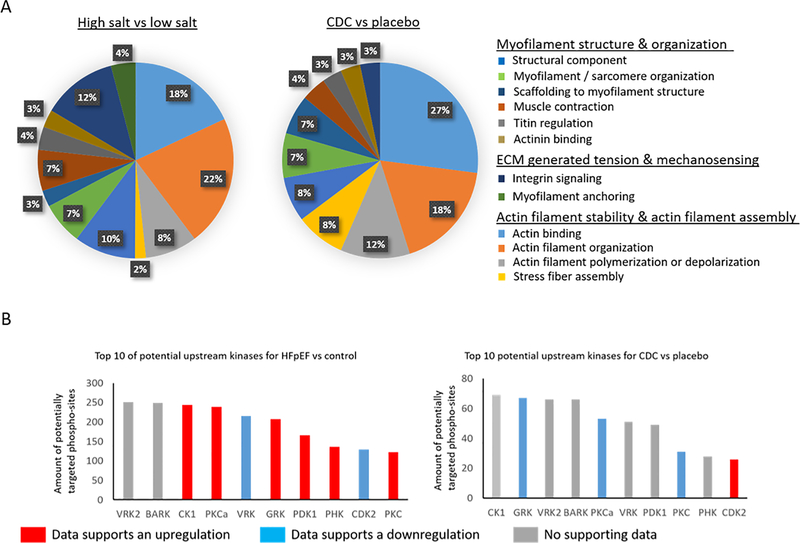
Figure 1:
Shown are the represented GO functions in percent for proteins significantly changed in HFpEF vs control left and for CDC vs placebo right within the subproteome of sarcomeric proteins A. With a bioinformatic approach using GPS 2.0, consensus sequences with potential upstream kinases were identified and the graph shows the kinases that potentially could target the most consensus sequences of changed phosphorylation-sites for HFpEF vs control left and CDC vs placebo right. The color of the bar of a given kinase indicates if there was supporting MS data indicating an upregulation by increased concentration of the kinase itself or by changes of a known regulator suggesting an upregulation (red), downregulation by decreased concentration of the kinase itself or by changes of a known regulator suggesting a downregulation (blue), or no supporting MS data (gray).

