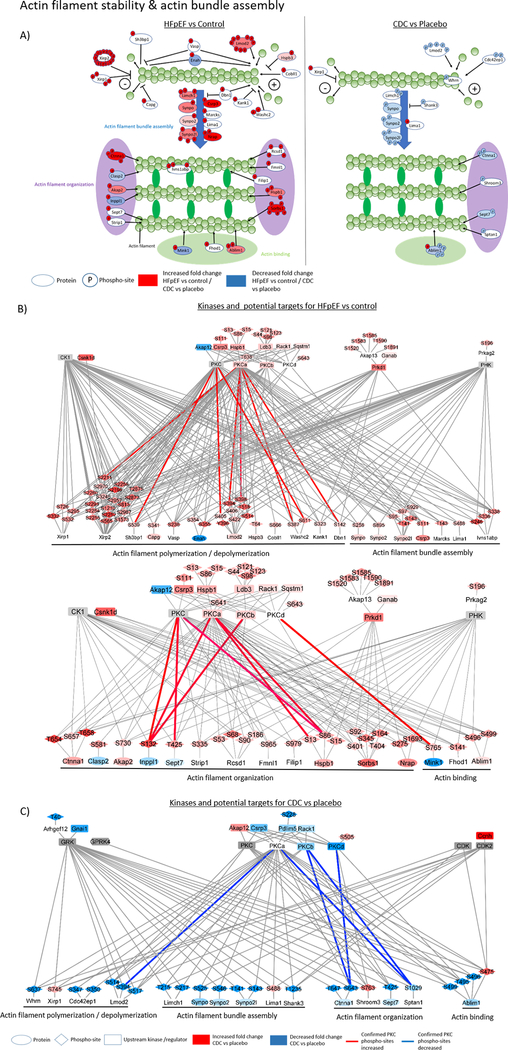
Figure 4:
The graphic shows sarcomeric proteins with changes in phosphorylation sites relevant for actin stability and actin bundle assembly. On the left are proteins with significantly changed phosphorylation in HFpEF versus control and on the right, a comparison of CDC versus placebo (A). The network figures show potential upstream kinases for altered phosphorylated sarcomere protein residues in HFpEF compared to control (B) and CDC compared to placebo (C) and was generated based on consensus sequence analysis using GPS2.0. Only kinases with MS data support for their changed activity concentration, phosphorylation or known regulators were included in the figure. The blue color indicates a downregulation and the red color an upregulation. The intensity of the nodelor represents the fold change intensity for HFpEF compared to control or CDC compared to placebo. Edge color shows PKC phosphorylation sites that were confirmed by kinase inhibition, kinase overexpression or recombinant kinase assay. Blue edges indicate a confirmed reduction and red a confirmed increase in phosphorylation confirmation experiments.

